
Bovine tuberculosis statistics and costs
Are you aware of the following?
-
In October 2016 the total number of cattle slaughtered in the UK to control TB since January 2001 exceeded that to control
Foot and Mouth
Total no of TB cattle slaughtered in UK up to end of Oct 2016 = 635,052
Bovine TB in GB
Year Slaughtered animals123 2001 6367 2002 22652 2003 24519 2004 22680 2005 29824 2006 22520 2007 27394 2008 39675 2009 38696 2010 32378 2011 34675 2012 37993 2013 32791 2014 33025 2015 36271 2016 to end of Oct 32598 TOTAL 474048 Bovine TB in NI
Year Reactor animals124 2001 8493 2002 15028 2003 16062 2004 15019 2005 10431 2006 9383 2007 7298 2008 8394 2009 8196 2010 6404 2011 8136 2012 10896 2013 8271 2014 8838 2015 11002 2016 to end of Oct 9153 TOTAL 161004
Please note that Northern Ireland publish the number of reactor animals only.
In Great Britain, Slaughtered animals = Reactors slaughtered + IRs slaughtered + Direct contacts Slaughtered.Foot and Mouth
Year Country Number of cattle slaughtered 2001 GB 581,802125 2001 NI 50,565126 2007 GB 982127 TOTAL - 633,349 -
Whilst bovine TB levels in New Zealand have plummeted, levels in Great Britain have soared.
For sources of data shown in the above graphs, please click here.
New Zealand started their TB eradication strategy in 1995 for which government funding for possum control became available from 1 July 1995.119 From this date the number of TB restricted herds in New Zealand plummeted.
England published the first draft of their eradication strategy in July 2011120 and in April 2014121 reported that the aim was to achieve Officially Bovine Tuberculosis Free (OTF) status for the whole of England by 2038 (i.e 25 years from 2013). Data122 upto Feb 2016 released on 11th May 2016 illustrated TB levels in England, South West England and South East England had reached new record highs.
- In New Zealand the bulk of the bovine TB budget is spent on pest management (70%). In the UK the bulk of the budget still goes on testing and compensation (80%).
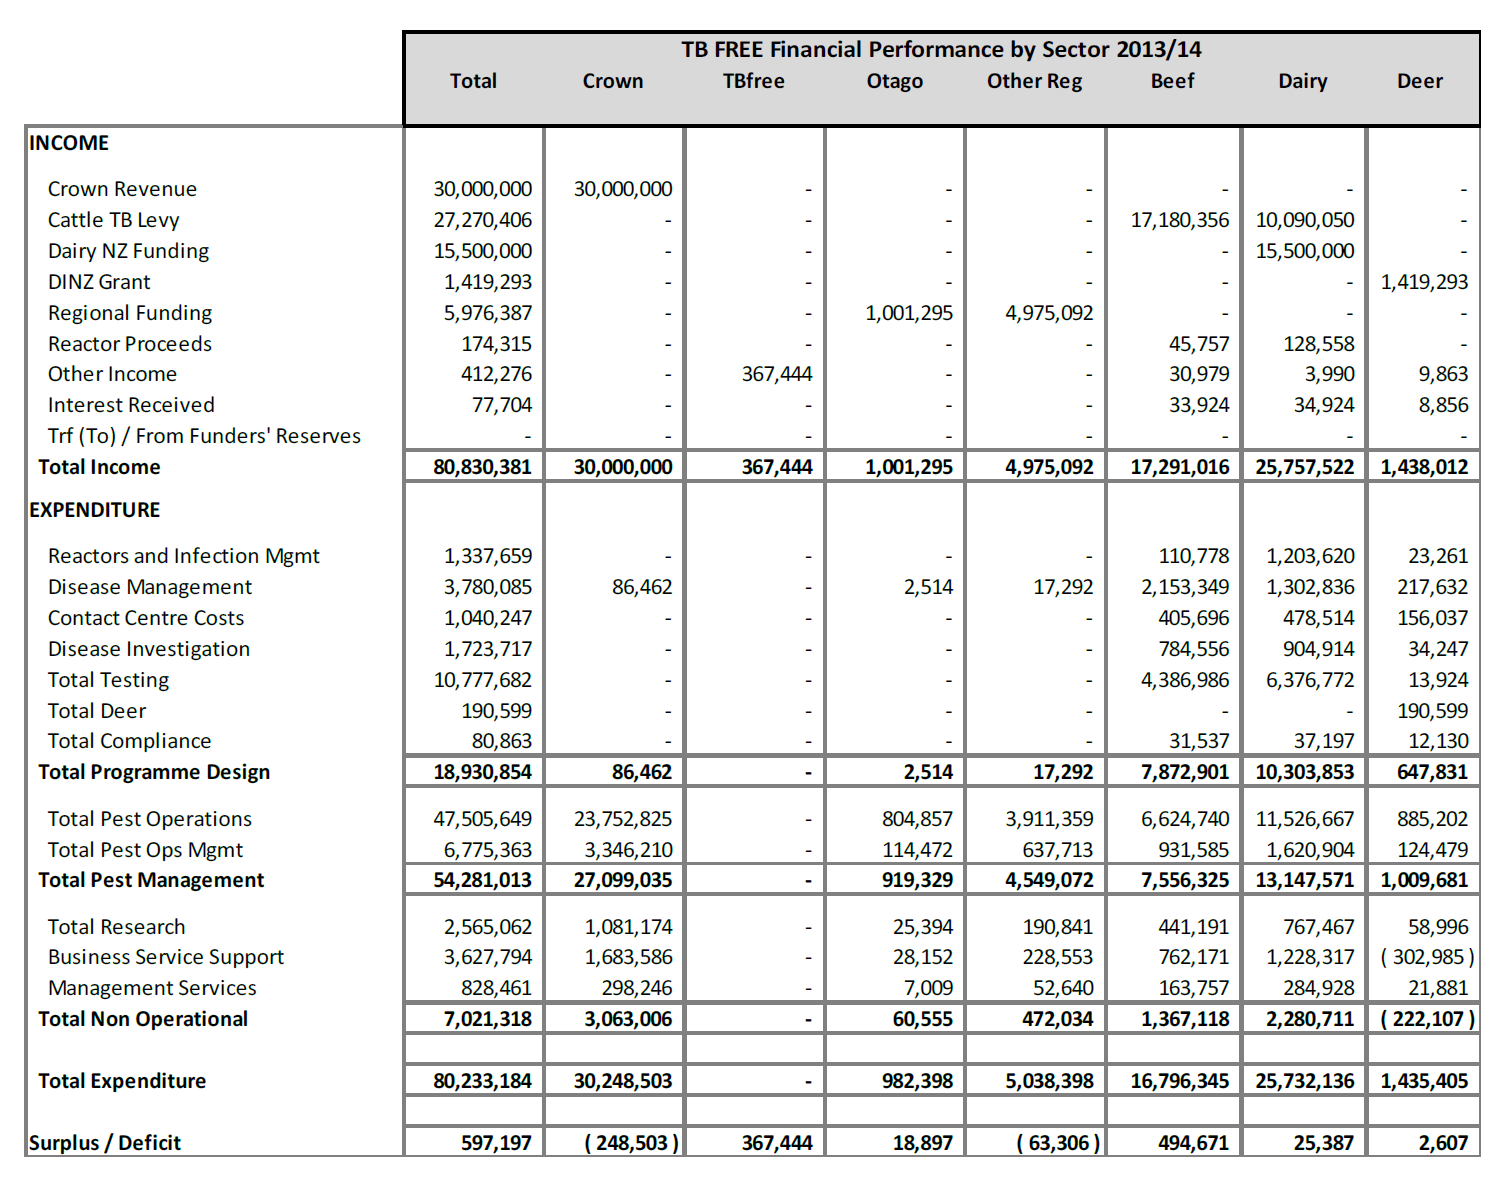
Please click here to see New Zealand's cost breakdown. Numbers are in New Zealand dollars. In 2014 one pound sterling was worth about two New Zealand dollars. This breakdown was extracted from Ref 107.
To see a budget breakdown for Great Britain, please click here . Numbers are in million pounds sterling.
-
In Great Britain in 2013/14, the forecasted spend on developing methods to cull badgers was 1% of the forecasted spend on developing vaccination options.
Ref 101, which was a reply to a Freedom of Information request dated 18th June 2014, states the following.
The current approved budget for work on alternative culling methods is £61,397 since August 2013 although this budget may be increased depending on the progress of the research.
In 2013/14, DEFRA budgeted £6.1m for research on vaccination.
Ref 102, which is a House of Commons Note which was last updated on 11 June 2014, states the following.Quantity 2010-11 2011-12 2012-13 2013-14 2014-15 2015-16 Oral badger vaccine research £2,476,273 £2,127,448 £1,684,948 £2,027,956 £2,008,748 £2,427,390 Injectable badger vaccine research £301,943 £136,178 £87,959 £66,387 £40,000 - Cattle vaccine and associated diagnostics research £2,683,843 £2,210,441 £2,709,163 £3,994,677 £2,041,706 £1,916,714 Total £5,462,059 £4,474,067 £4,482,070 £6,089,020 £4,090,454 £4,344,104 - 2013 was the worst year since records began for the number of TB restricted herds in England.
- In Devon, Cornwall and Gloucestershire less than 5% of dairy herds with 50 or more cattle have remained TB free between 1990 and 2012.
The following table shows TB-restricted, dairy herds with 50 or more cattle which existed between 1990 and 2012.Data in the above table were extracted from Reference 86.County Herds Never Restricted Been Restricted Restricted (%) Never Restricted (%) Cornwall 535 19 516 96.4 3.6 Devon 1000 46 954 95.4 4.6 Gloucestershire 152 3 149 98.0 2.0 Hereford & Worcester 137 7 130 94.9 5.1
To see proportions when lesser constraints apply, please click here.
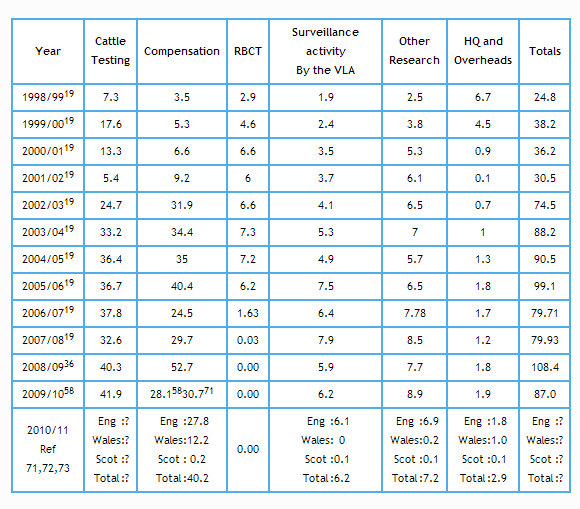
- In 2009/10 the tax payer paid £87 million to address bovine TB in Great Britain.
As you can see, testing and compensation tend to be the largest costs.
Year Cattle
TestingCompensation RBCT Surveillance activity
By the VLAOther
ResearchHQ and
OverheadsTotals 1998/9919 7.3 3.5 2.9 1.9 2.5 6.7 24.8 1999/0019 17.6 5.3 4.6 2.4 3.8 4.5 38.2 2000/0119 13.3 6.6 6.6 3.5 5.3 0.9 36.2 2001/0219 5.4 9.2 6 3.7 6.1 0.1 30.5 2002/0319 24.7 31.9 6.6 4.1 6.5 0.7 74.5 2003/0419 33.2 34.4 7.3 5.3 7 1 88.2 2004/0519 36.4 35 7.2 4.9 5.7 1.3 90.5 2005/0619 36.7 40.4 6.2 7.5 6.5 1.8 99.1 2006/0719 37.8 24.5 1.63 6.4 7.78 1.7 79.71 2007/0819 32.6 29.7 0.03 7.9 8.5 1.2 79.93 2008/0936 40.3 52.7 0.00 5.9 7.7 1.8 108.4 2009/1058 41.9 28.15830.771 0.00 6.2 8.9 1.9 87.0 2010/11
Ref 71,72,73Eng:?
Wales:?
Scot:?
Total:?Eng:27.8
Wales:12.2
Scot:0.2
Total:40.20.00 Eng:6.1
Wales:0
Scot:0.1
Total:6.2Eng:6.9
Wales:0.2
Scot:0.1
Total:7.2Eng:1.8
Wales:1.0
Scot:0.1
Total:2.9Eng:?
Wales:?
Scot:?
Total:?
To see how the cost of each test and each compensation payment has changed since 1998, please click here.
To see how testing costs in England, Wales and Ireland compare with those in New Zealand and why these costs are so different, please click here.
-
In 2006, the UK and Irish Republic had an incidence of TB which exceeded that in any other European country by more than 5 times.
The table below shows the top ten affected countries in Europe. In Great Britain, Scotland is a lot less affected than England and Wales. In fact Scotland in 2009 gained Officially Tuberculosis Free (OTF) status. The national herd incidence represents the number of new reactor herds divided by herds tested during the year as defined in the Government Veterinary Journal.On 30 September 2005 (unless otherwise stated), the following European countries had achieved official TB-free status:Country National herd incidence (%) Northern Ireland 9.17 Great Britain 6.87 Ireland 5.72 Spain 1.11 Greece 0.74 Italy 0.62 Portugal 0.17 Poland 0.04 France 0.03 Germany 0.01
Austria
Belgium
Czech Republic
Denmark (2003 data)
Finland
France (2003 data)
Germany
Luxembourg (2003 data)
Netherlands (2003 data)
Slovakia
Sweden
All the above data was taken from the Government Veterinary Journal.
-
In England, Gloucester is the worst affected county.
-
In Wales, Pembrokeshire is the worst affected county.
-
Lancashire, Cumbria and North Yorkshire cover large areas with dense cattle populations and indeed are in the top 10 English counties for high numbers of "on" cattle movements per square kilometre. Yet all three counties are low risk areas and have
maintained a very low
number of TB restricted herds each year since 1998.
In England there is weak correlation between the number of cattle movements and the number of TB restricted herds in counties with high cattle movement.
Please click on the thumbnail below to see the charts clearly.Please click here for further details.
-
In 2006 the European Commission issued a guidance report which states alternatives to vaccination should be implemented without any delay and the role of infected wildlife addressed. Under the EU funding agreement, the EU would provide up to 50 per cent of the funding for an effective eradication plan.29
The following is an extract from a report titled Eradication of Bovine Tuberculosis in the EU.
" An active approach to the removal of TB-infected wildlife and the urgent development of alternative means of preventing transmission of TB from this source to cattle is proposed. It has now been reliably demonstrated that the persistence of an infected wildlife reservoir that enters into contact with cattle is a major obstacle to the eradication of TB. This obstacle should be addressed in tandem with the measures implemented in relation to the cattle population.
While future prospects for the development of suitable TB vaccines for use in wildlife are promising, considerable obstacles remain which make it difficult to foresee the use of such vaccination on its own as the most suitable tool to use to address the persistence of the variety of infected wildlife reservoirs worldwide in the near future. In the meantime, therefore, alternatives to vaccination, in order to address the role of infected wildlife in the persistence of TB should be implemented without any delay so as to allow the progress of the eradication programmes.
Removal of wildlife, either proactively or reactively following outbreaks, has proven to be an effective ancillary, and in certain situations necessary, measure to control and eradicate TB. "
It then goes on to say the following.
"The elimination or reduction of the risk posed by an infected wildlife reservoir enables the other measures contained in the programme to yield the expected results, whereas the persistence of TB in these wildlife populations impedes the effective elimination of the disease."
Regarding short term measures, it further says the following. (The underlined text in the second paragraph is of particular note)
"It is necessary to further explore and assess the impact of certain well-defined recommended measures that can be evaluated and incorporated into TB eradication programmes in the short term.
Those deemed appropriate for the current situation in a particular member state should be applied to a relevant degree and, for those deemed inappropriate, a sound explanation for disregarding or modifying them should be provided."
EU funding received by England from 1998 to 2008, and a request to and response from DEFRA regarding this, is shown here.
-
Natural England typically received just less than 1,000 applications each year between 2001 and 2010 for licences to address issues relating to badgers76
Please click here for further details.
-
Since 1998 TB levels have quadrupled in England whilst they have halved in Ireland
Details are given here.
-
In Great Britain the proportion of cattle reacting to the tb test reduced by a factor of 4 in just 5 years after 1960
The graph below shows the number and rate of tuberculin test reactors disclosed annually in Great Britain from 1956 to 2006. This was reproduced from the Report of the Chief Veterinary Officer 2006, Defra 2007.30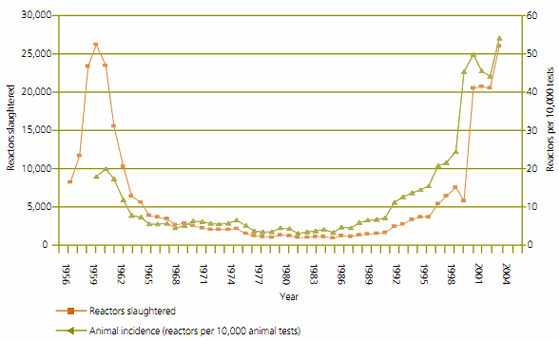
-
Recorded cattle incidences started to rise during the 'interim strategy' which was a badger culling strategy implemented between 1986 and 1998
largely due to the economic costs of the previous strategy.
Gassing of badger setts took place between 1975 and 1982.
The 'clean ring strategy' was introduced in 1982 and involved cage trapping badgers on land occupied by affected cattle herds, then on adjoining land, expanding outwards until no further infected animals were captured.62
In 1986 this approach was replaced by the 'interim strategy' which involved culling badgers only on land occupied by affected cattle herds. The last 'interim' culls were performed in 1998, prior to the start of the RBCT.62
This 'interim' strategy was recommended because a cost-benefit analysis63 showed the high cost of the clean ring policy could not be economically justified.27
- DEFRA does not collate the number of newly infected herds which are closed.
A closed herd is often used to describe a herd in which all stock is replenished by artificial insemination. All cattle movement is recorded by the British Movement Cattle Scheme. In order to continue trading a farmer has to update a document known as a passport whenever an animal is bought, sold or moved. If it was possible to collate the number of newly infected herds which are closed, this would help to reveal the extent to which the disease is being spread by non cattle-to-cattle means. One such source is through badger-to-cattle contact such as occurs when cows ingest grass close to badger setts9 and when badgers enter farm buildings whilst searching for food.10 The following is an extract from a reply made by DEFRA who try to follow the guidelines outlined here when responding to requests.
We do not hold a record of the number of "TB restricted herds which solely rely on artificial insemination for regeneration and growth." Information on `closed herds' as we call them, is gathered during the disease inquiry following an incident of TB in a herd and is recorded on individual files at the time but is not collated to give an overall figure. In addition, occasionally, farmers will be forced to abandon their closed herd policy and buy in cattle because of the losses suffered during the breakdown, hence making our record inaccurate.
- There are no restrictions on where 'sick / mended' badgers are released by 'sanctuaries' .
These places are not licensed by DEFRA, and although they may use a 'voluntary protocol' to release badgers, this is neither drawn up nor approved by Defra.
Animal hospitals are not legally required to test badgers for Tb before release.64
About 70 badgers each year were reported65 in 2007 to be released by the wildlife rescue centre called Secret World.66 In 2003 a voluntary Badger Rehabilitation Protocol67 was drawn up by
- Secret World Wildlife Rescue
- National Federation of Badger Groups and
- The Royal Society for the Prevention of Cruelty to Animals
Although it recommends testing badger cubs, it says the following regarding the testing of adult badgers.
An adult badger should not be blood tested for bovine TB for the following reasons:
- It will be released to its original location, so eliminating the opportunity for the spread of disease to new areas;
- Recent published data show that a single blood test is unreliable (Forrester et al., 2001);
- It is unlikely to be held in captivity long enough to conduct three blood tests.
The above extract67 refers to the release of untested adult badgers. The following extract66 refers to the release of badgers raised as cubs which the protocol67 does recommend testing. The RBCT Final Report27 described the ELISA badger test (or Brock test) as having low sensitivity which severely constrained abilities to identify and remove infected social groups. The protocol67 recommends applying this test 3 times to improve the detection rate.
Because badgers are highly social and territorial animals the release is not simple, by the time the cubs are ready for release they will not be able to be returned to where they were found, if that is known, because they will be treated as aliens by the resident badgers, at best being driven off and at worst killed, this means that a release site for the entire site has to be found.
If the badger test is 40% sensitive and is repeated 3 times, one in five infected badgers would be missed. In Gloucestershire when 300 badgers were triple tested each year for 4 years between 2006 and 2009 using a suite of tests with an overall sensitivity which was estimated to lie between 61% and 86%, about half of the tested badgers were found to be infected.109
In releasing badgers back into new areas, badger sanctuaries may be seeding TB into clean areas.
-
The BCG vaccine was only found to reduce the prevalence of TB in badgers by about 8% when administered for 4 years on a group by group basis
In 2006, infection was detected in 53% of the 112 badgers tested. The sensitivity of the combined test was reported to lie between 61% and 86%. At face value if this sensitivity is taken into account, the actual proportion of badgers infected in 2006 exceeded 70%. After 4 years, infection levels in vaccinates were calculated to be 33.8% compared to 36.8% in controls. This translates to the vaccine reducing badger infection by 8%. (36.8 - 33.8) / 36.8% = 8%. Due to small sample size this percentage should be treated as approximate. In addition to this, badgers were vaccinated on a group by group basis and not across a wide area so the mixing between vaccinated and unvaccinated groups was greater. This presented a greater challenge to those groups which were vaccinated and reduced the force of the infection to the control groups. Both of these influences would cause the impact of the vaccine to be less than if the vaccine were applied over a wide area as it typically would be in practice. However the very small benefit of the vaccine on badgers after 4 years as shown in the above graph gives no reassurance that a noticeable and worthwhile impact will be seen in cattle after 5 years in the Intensive Action Area of Wales.
For a more complete picture of how the vaccine reduced disease levels in badgers in the Gloucestershire trial, please click here.
-
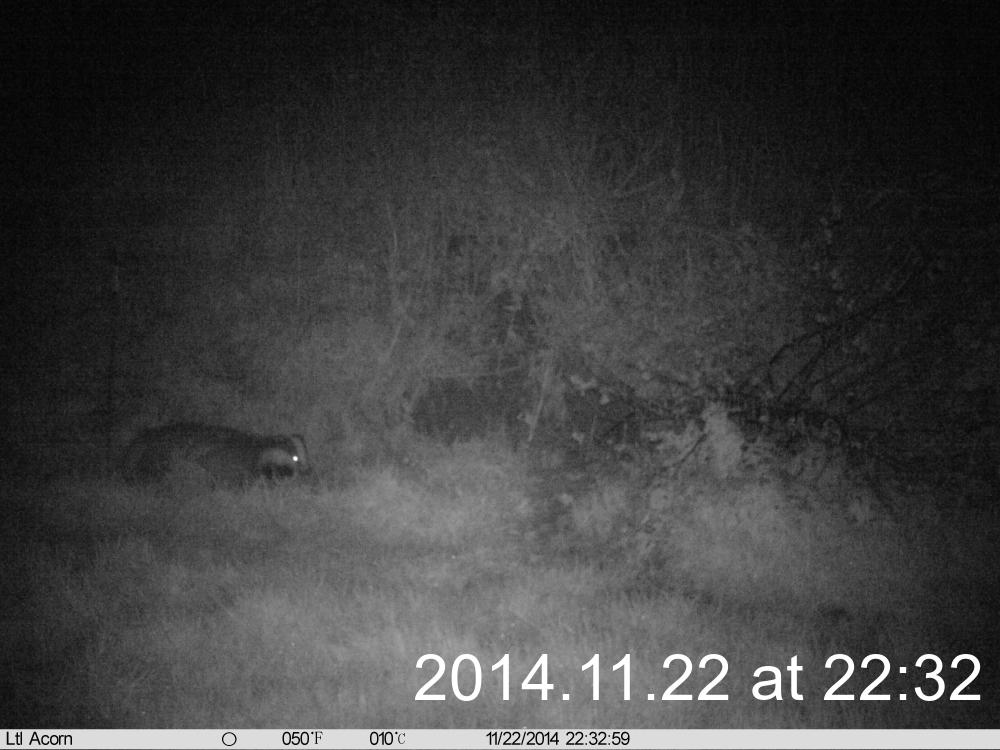
Some farmers have been spending thousands of pounds on biosecurity to help reduce the risk of cross-species transfer. For example,
diseased badgers tend to take up
residence close to easily found food sources in the last few months of their lives.
Typically this would be in or close to farm buildings.
It is probably the smaller number with
advanced disease, that result in overspill from the reservoir of infection in badgers, which infect
cattle.9 These moribound super excretors are shedding large volumes of bacteria and are in frequent and close contact with cattle so,
where buildings are open, perhaps
measures should be taken to keep these badgers out.
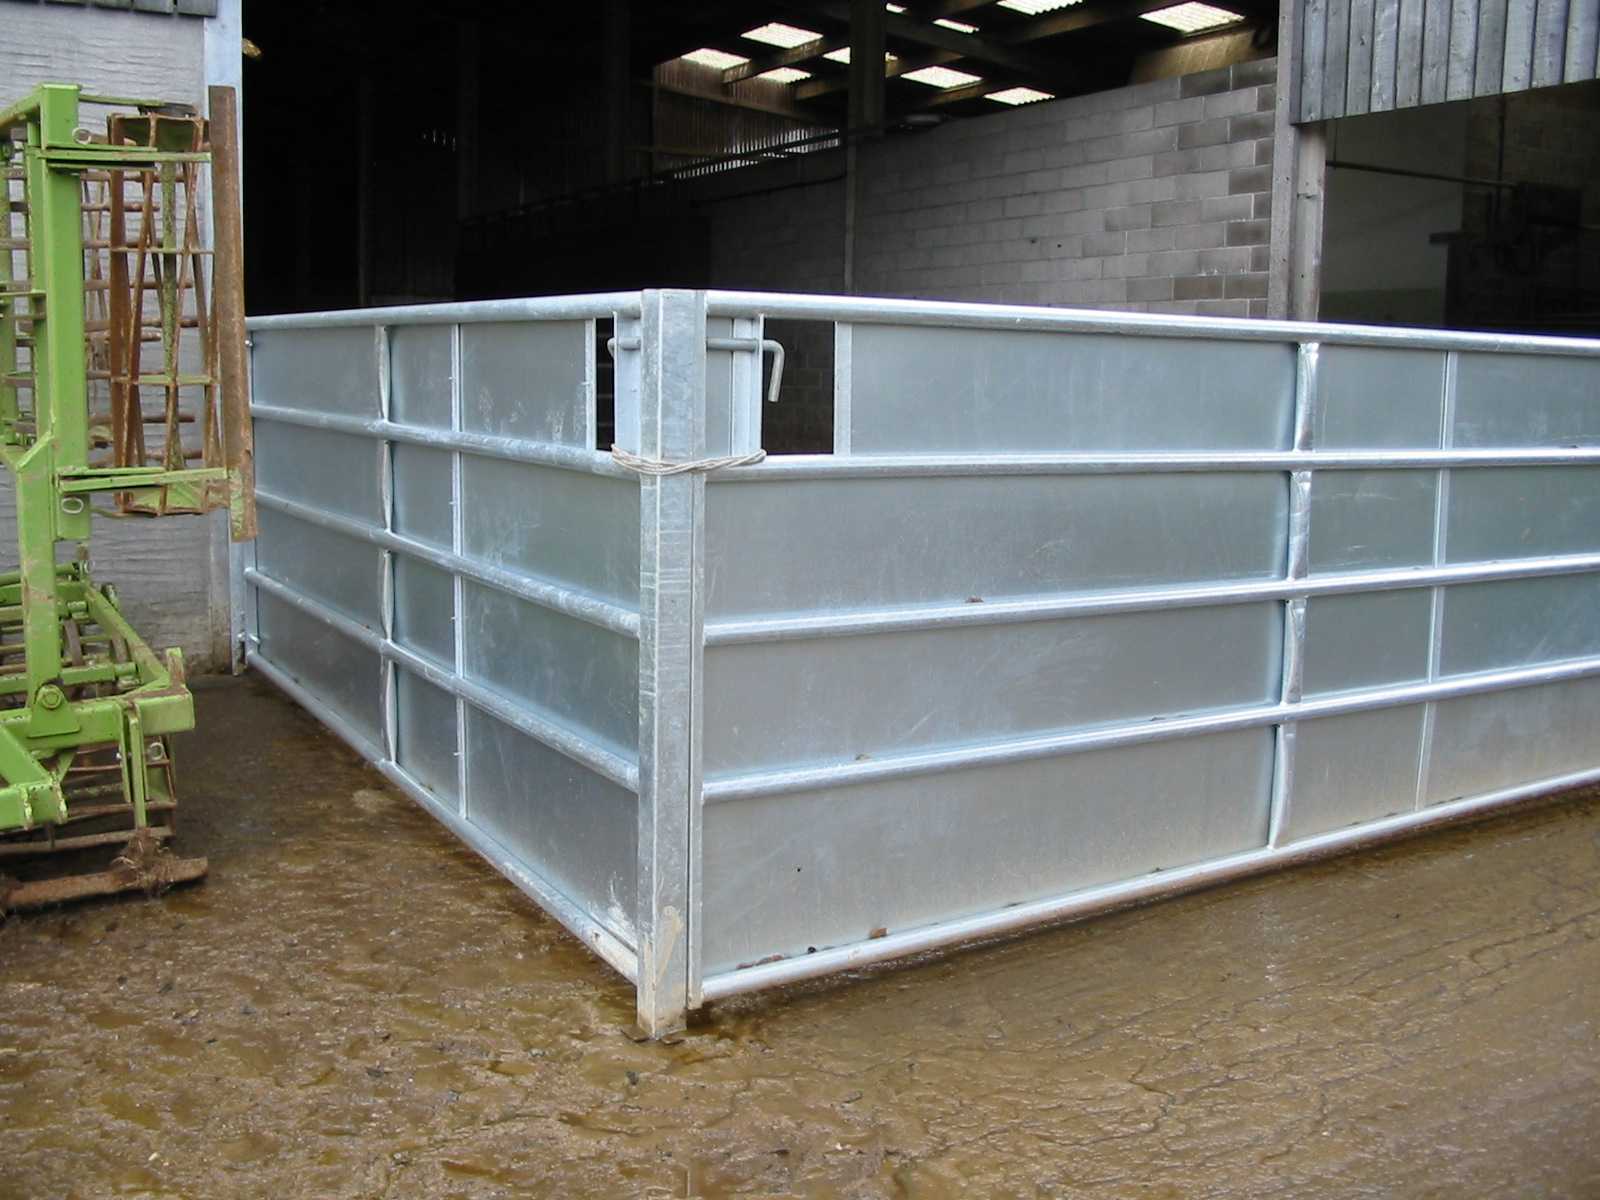
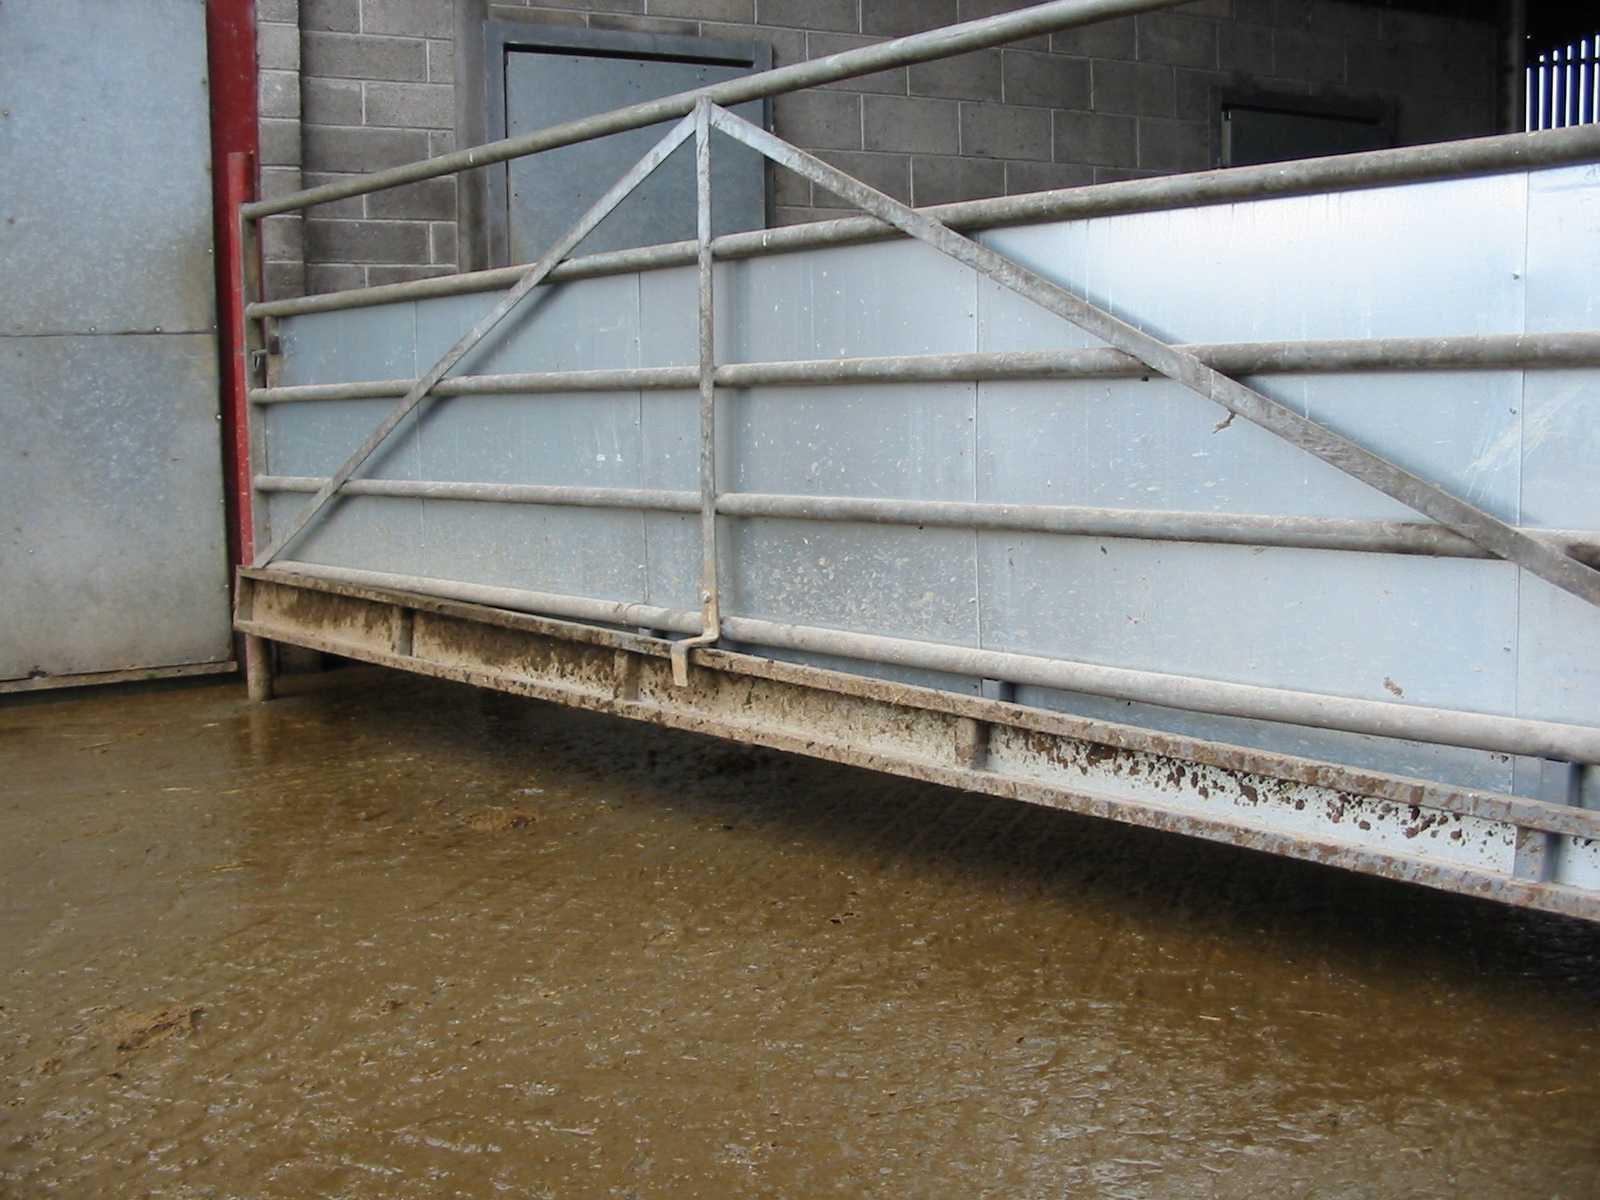
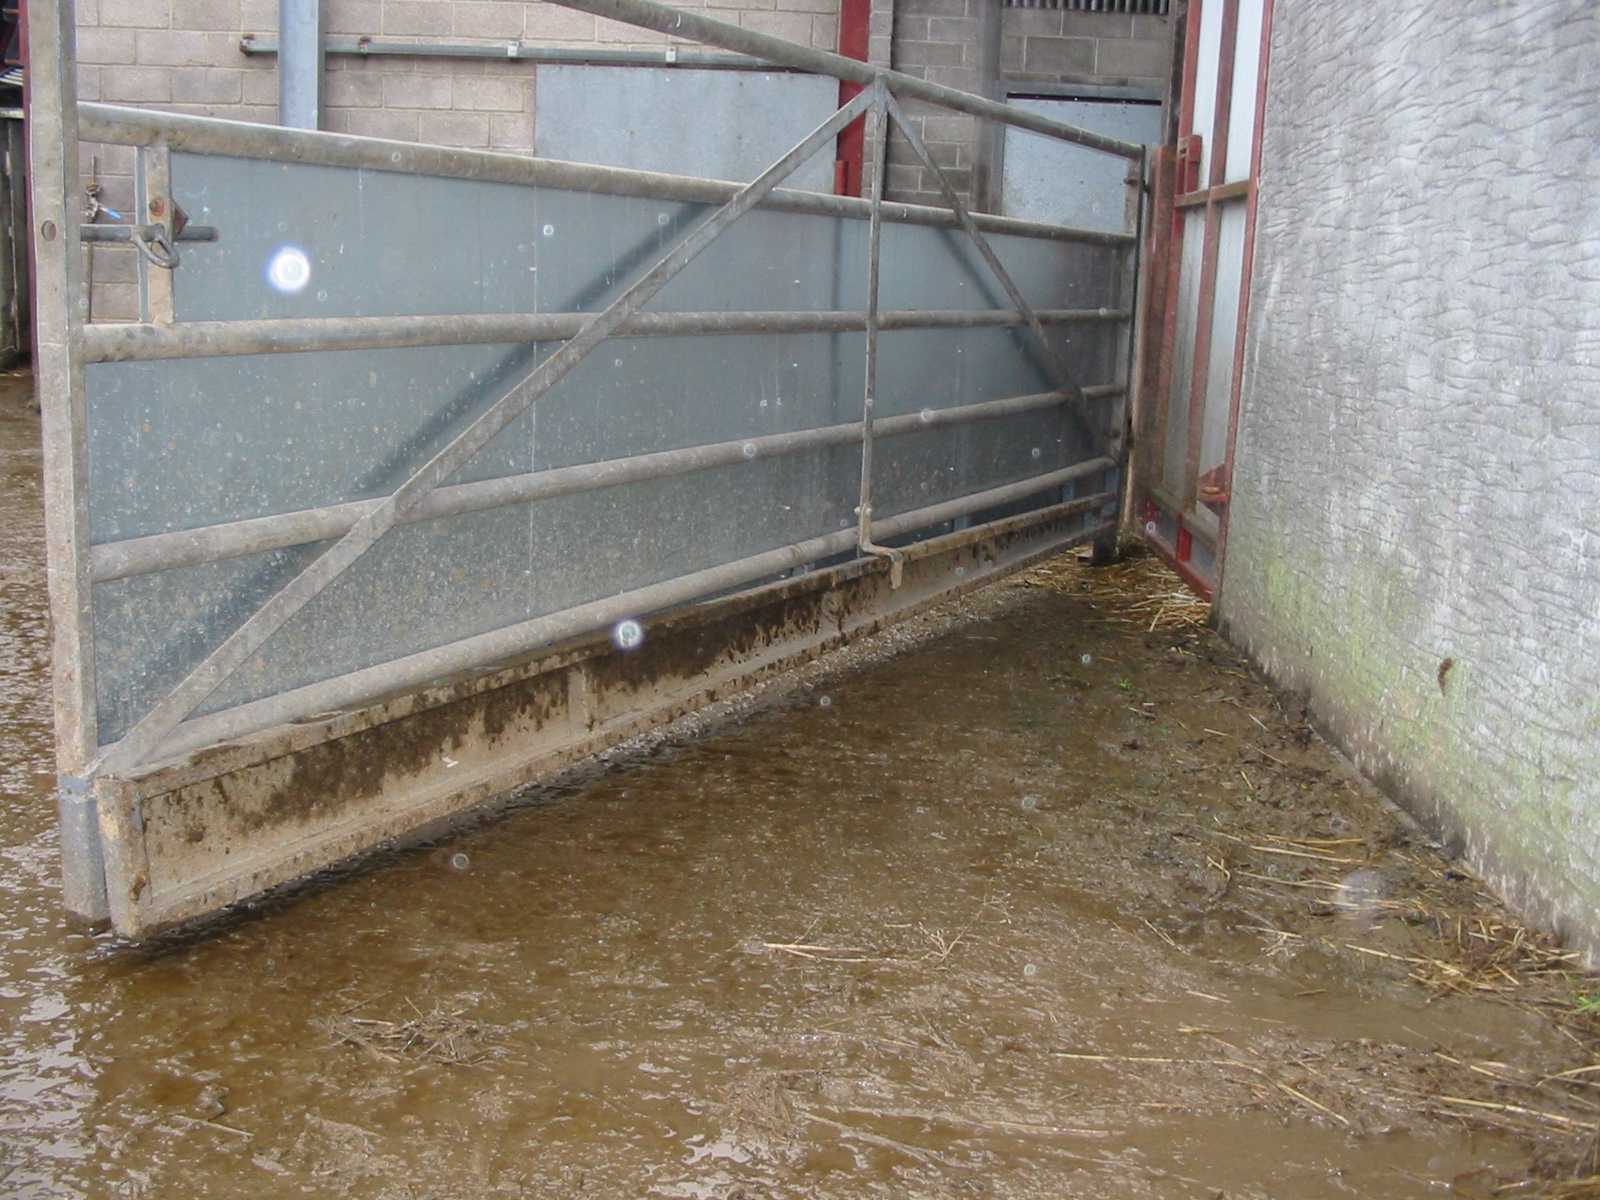
Click on the thumbnails below to see pictures of a wall and sheeted gates designed to stop badgers entering farm buildings.The cost of the above wall and gates came to £9403.81 excluding VAT. This cost breaks down as follows.
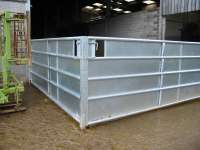
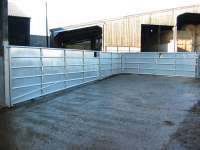
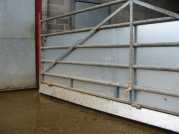
The thumbnails below show different views of a third gate with a drop-down which was designed by the farmer and steel worker to accommodate changing clearance with the ground as the gate is opened.
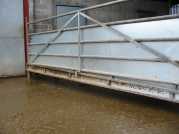
 This work was carried out on a small, 100-cow, family-run, dairy farm which went down with bovine TB in the summer of 2008. This is a closed farm in so far as no new stock from outside herds had been allowed on the farm and no stock had been taken off and returned to the farm since 1989. This farmer was fortunate in so far as the layout of the buildings were such that erecting a badger barrier was not prohibitively expensive. Many farm building layouts however are too open to allow effective sealing without incurring massive investment.
Item Cost (£) Sand 135.10 Concrete blocks 396.00 Cement 133.71 Labour for wall construction 2092.00 Steel + labour for metal work 6647.00 Total 9403.81
Subsequent to sealing his buildings in Sep 2008 this farmer cleared all tests up to April 2012 but failed the test on several subsequent occasions.
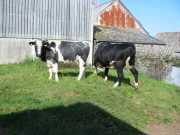
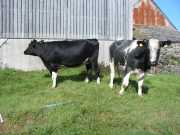
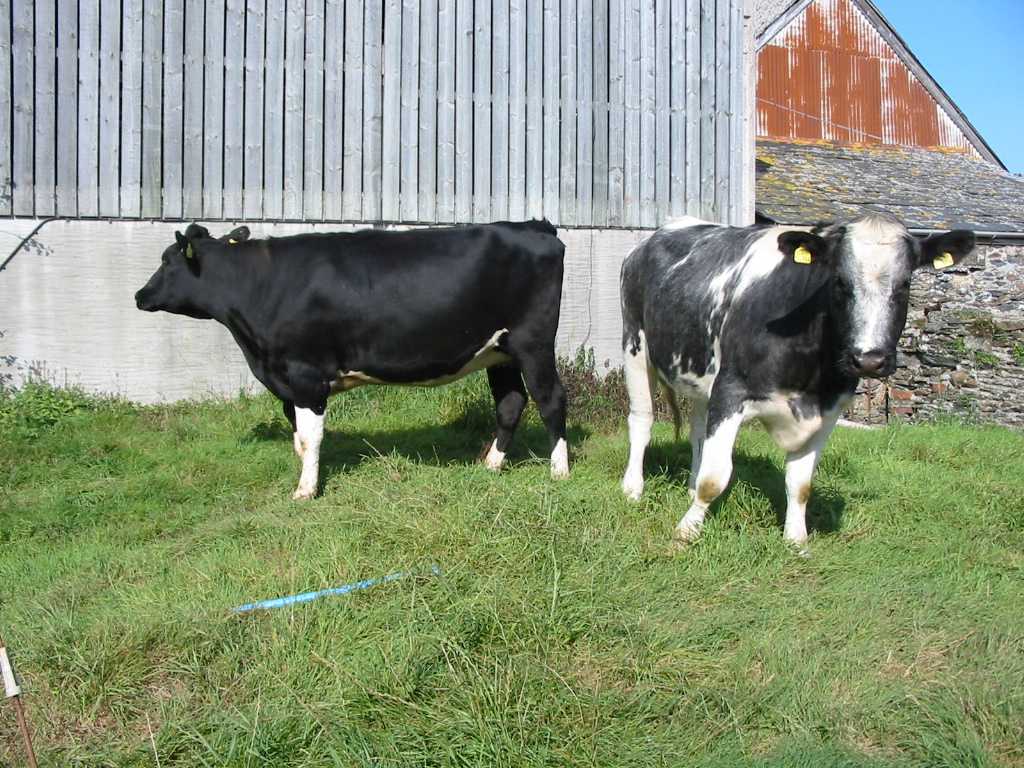
In September 2014, a thorough test was performed and thirteen reactors were found. Thumbnails of 2 of the 13 cattle condemned are shown below. The friesian was in calf with sexed semen and was expecting in 3 months time. She and her unborn calf will be slaughtered within the week. 25 reactors were found on 30th January 2015.Since installing the barriers in 2008, each building was secured using the installed badger barriers at the end of each working day. In addition to allowing no new stock from outside herds to be allowed on the farm and taking no stock off and returning no stock to the farm since 1989, the farmer in March 2012 purchased a brand-new slurry spreader which has been used exclusively on the farm to avoid the risk of using shared, contaminated equipment.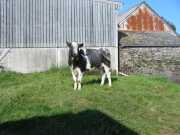
Unfortunately the farm contains a number of badger setts. This may be relevant in view of the following extract taken from Reference 85.
It is known that badgers will roam more than a mile in search of food and although they use communal dung pits, faeces have been found on the surface of pasture and in hedgerows. They also urinate randomly. Pasture can therefore be contaminated by infected badgers and can thus be a hazard to healthy cattle when grazing despite vigorous control procedures within herds at risk. -
TB was found to be the major cause of natural death in badgers in the largest study ever undertaken into causes of badger death
During the period 1973 to 1976 inclusive, 1206 badger carcases were examined for evidence of tuberculosis and other diseases. Tuberculosis was the major cause of natural death, killing 39 per cent of the "natural death" cases, followed by bite wounding and starvation. Road traffic accidents were the greatest single cause of death.115 -
Badger TB deaths peak in the Spring
Badgers push their boundaries most in Febraury / March.113,115 Badgers die relatively quickly from TB caused by bite wounding.114,115 Such wounding may occur when defending territory.114
-
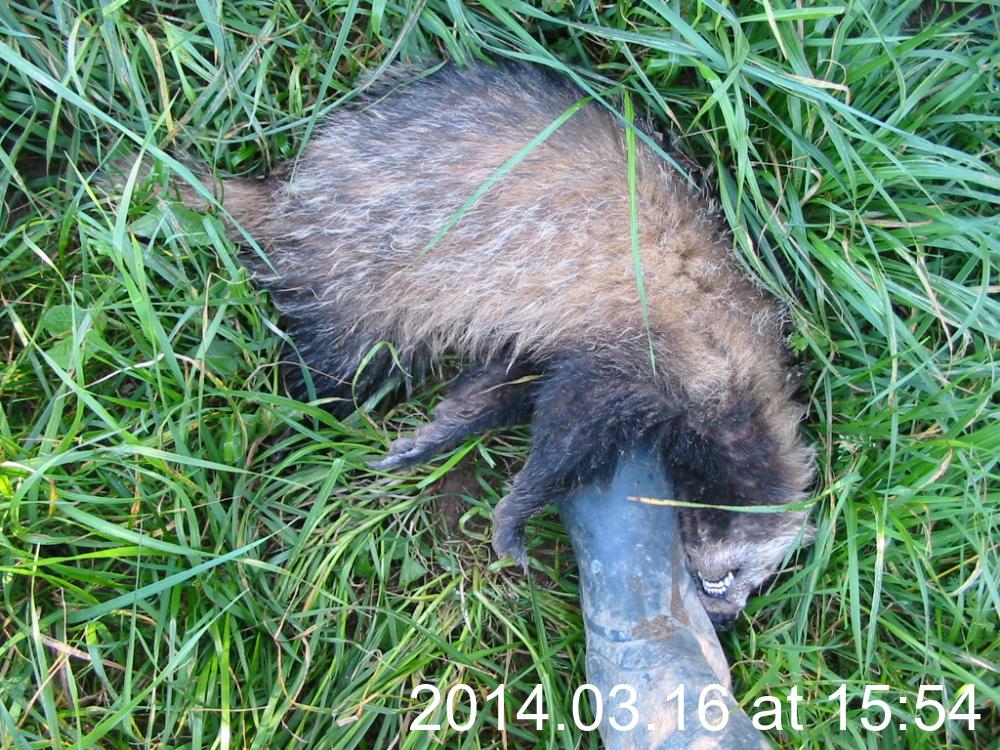
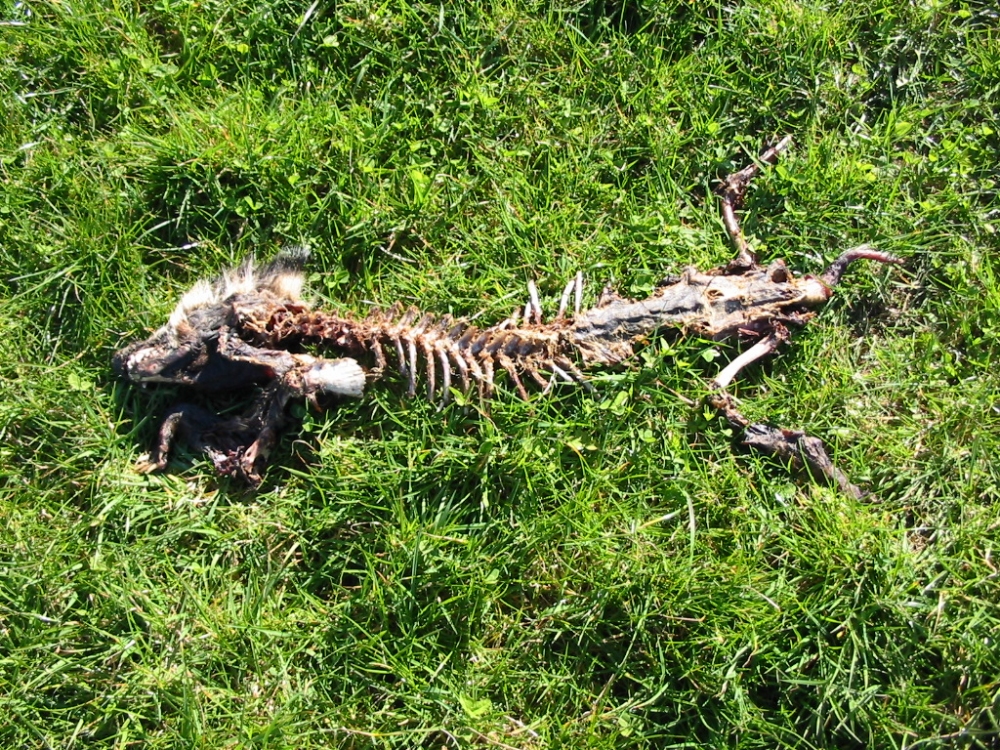
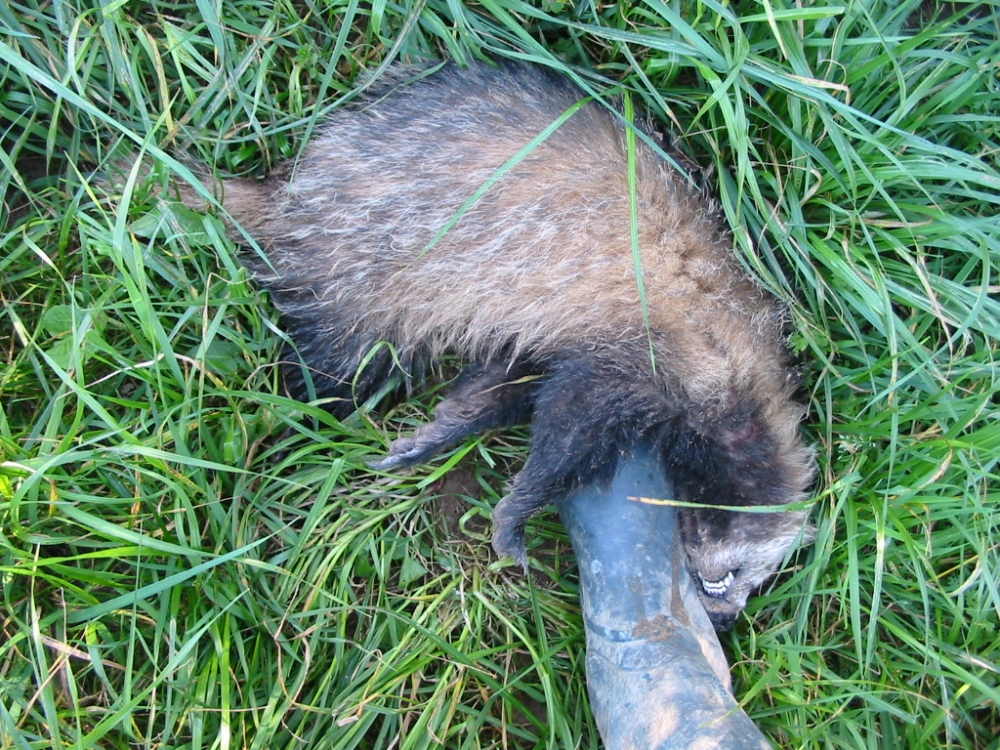
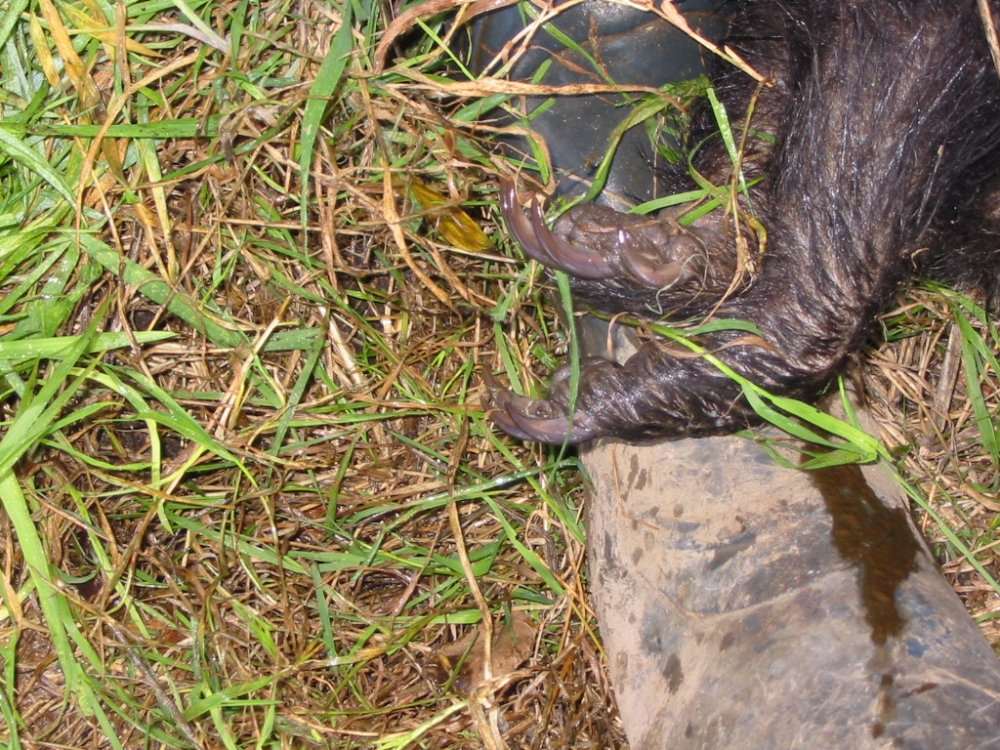
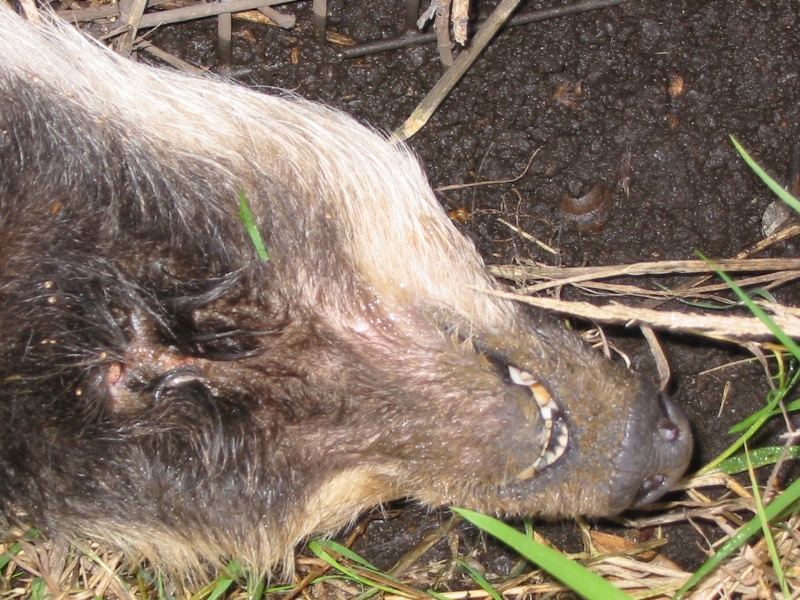
Farmers should look out for dead badgers when turning out stock
The farmer who had taken all the measures described above to keep badgers out of his buildings (including spending £9000 on badger barriers) found in the week ending 14th March 2014, which was a month after becoming free to trade again, two dead badgers within a distance of 3 small fields apart in fields either side of his secured buildings. These were found whilst repairing fences prior to turning his cattle out to these fields. Pictures of the badgers, one of which was very badly decomposed are shown below. Click on them to see larger views.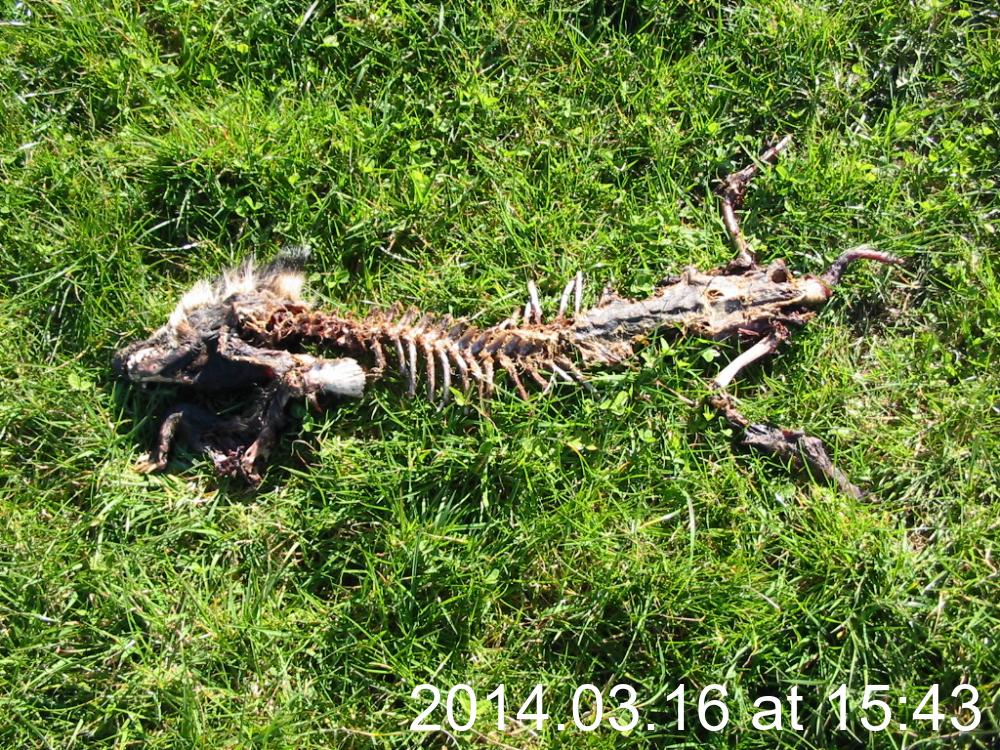
-
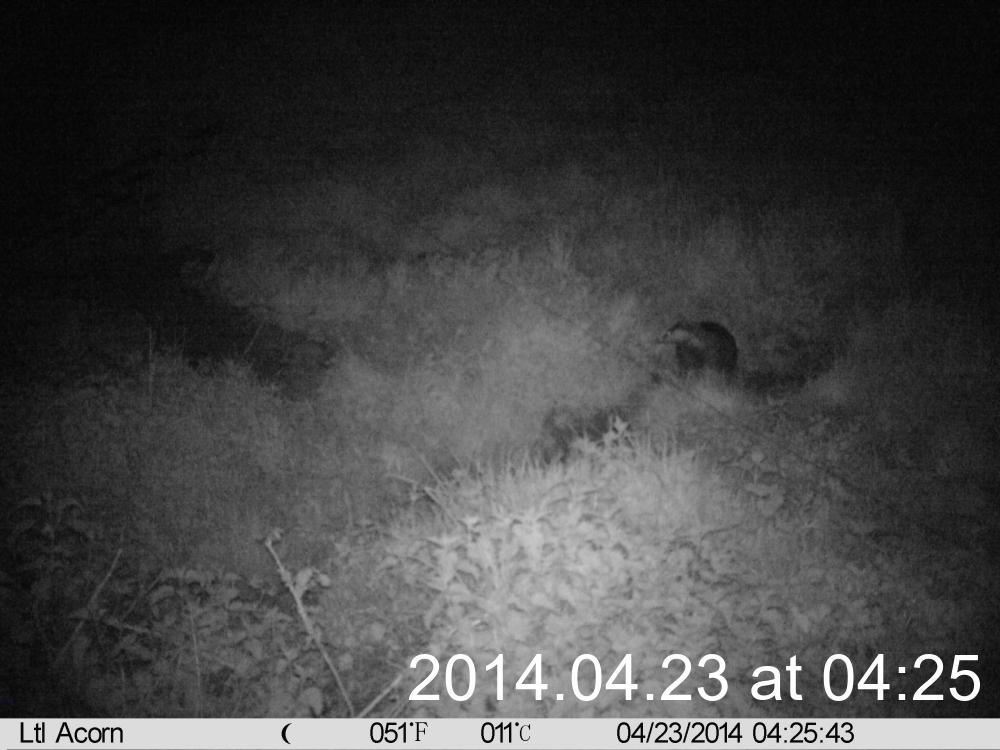
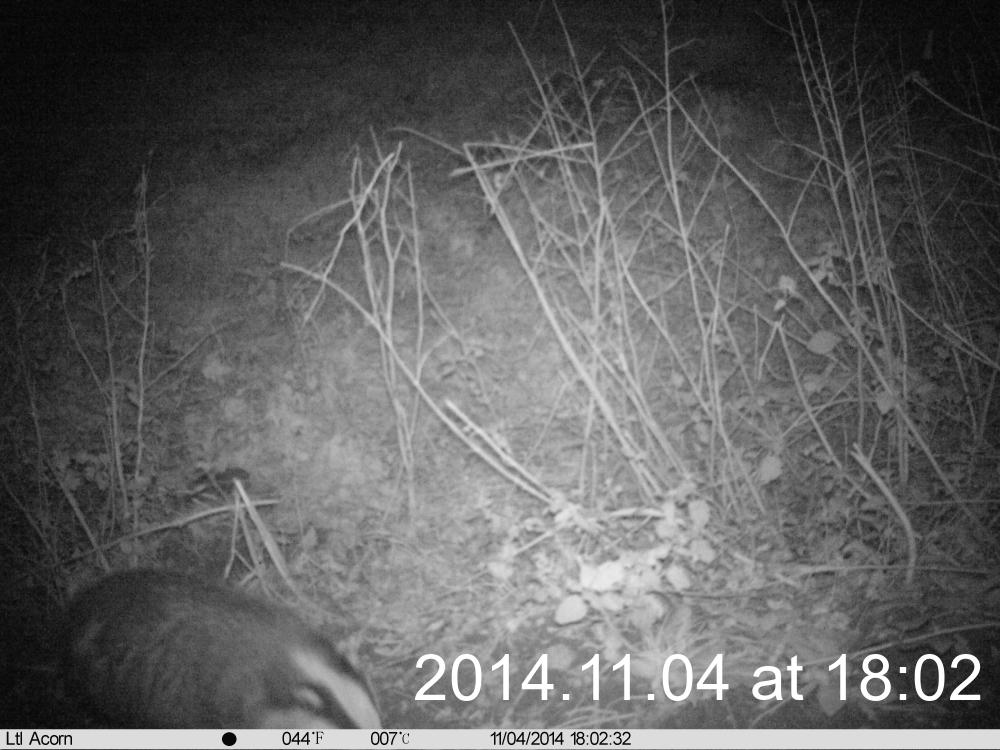
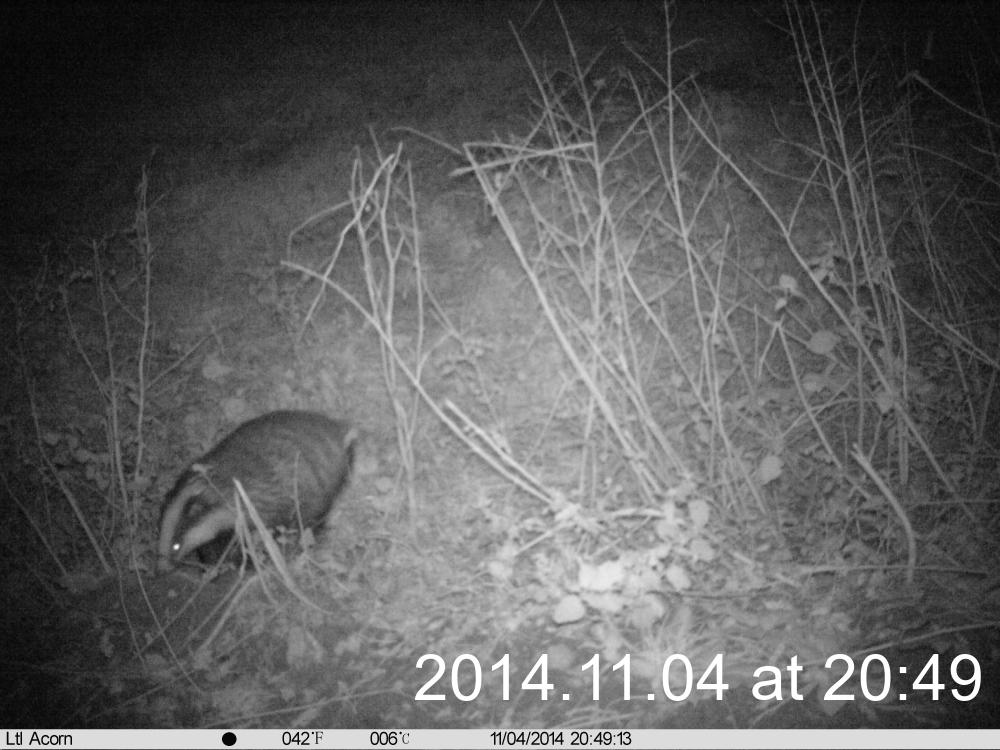
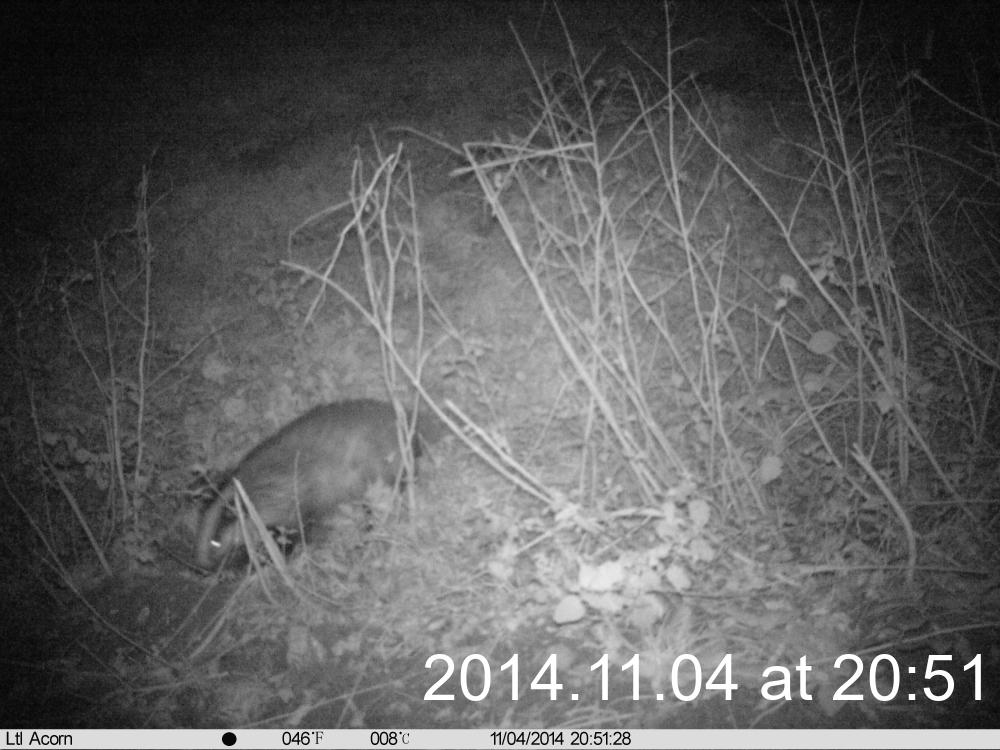
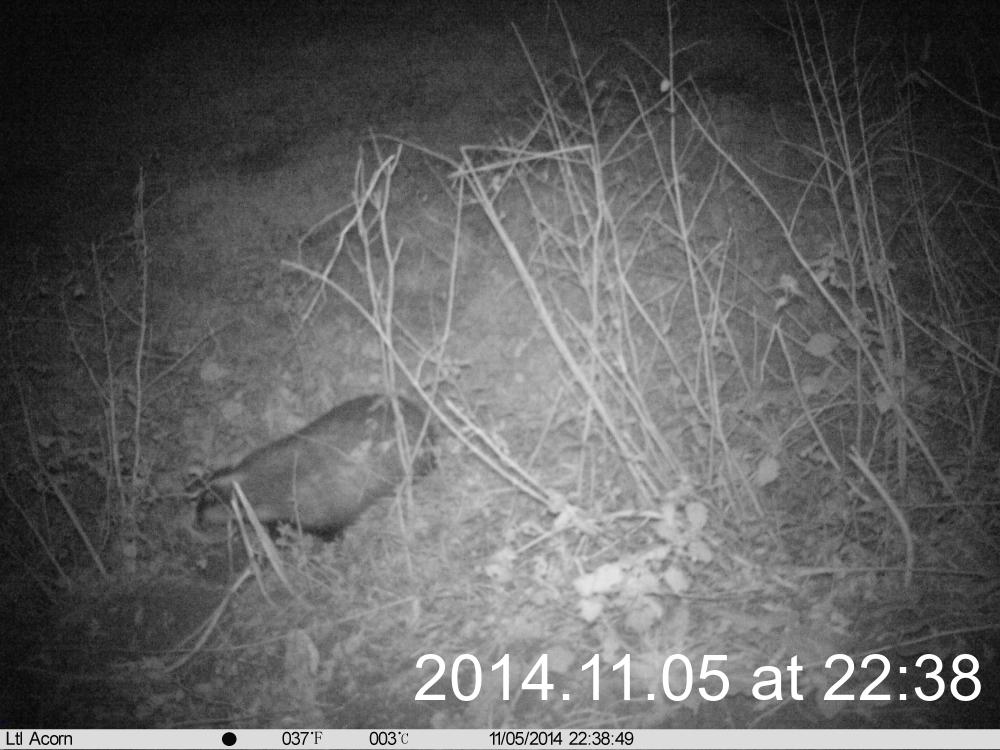
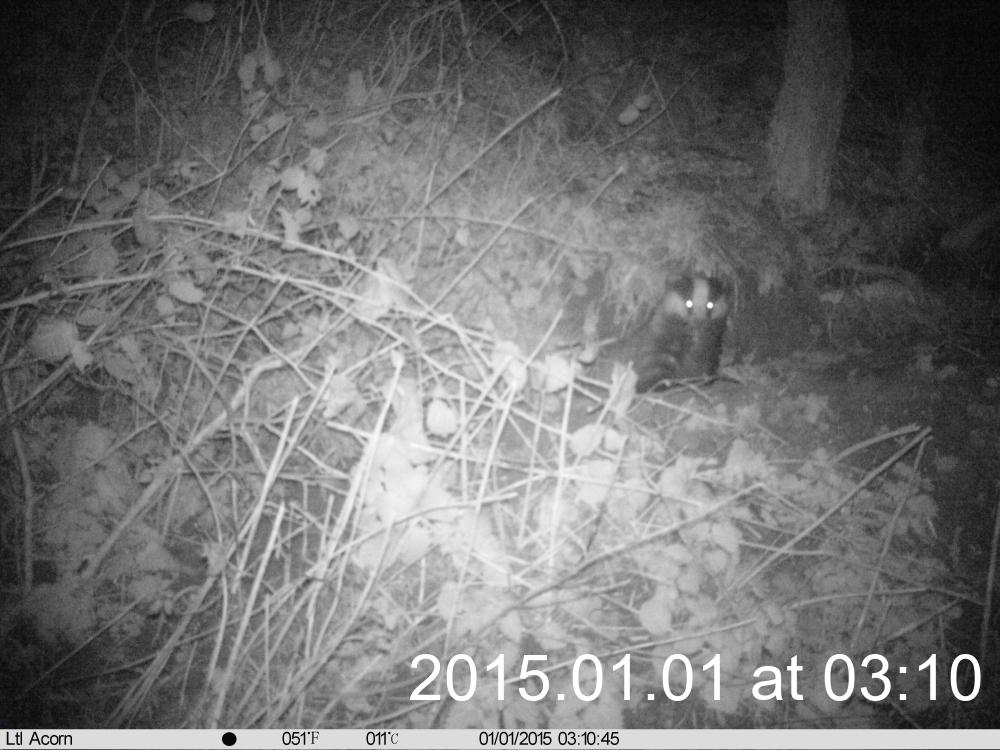
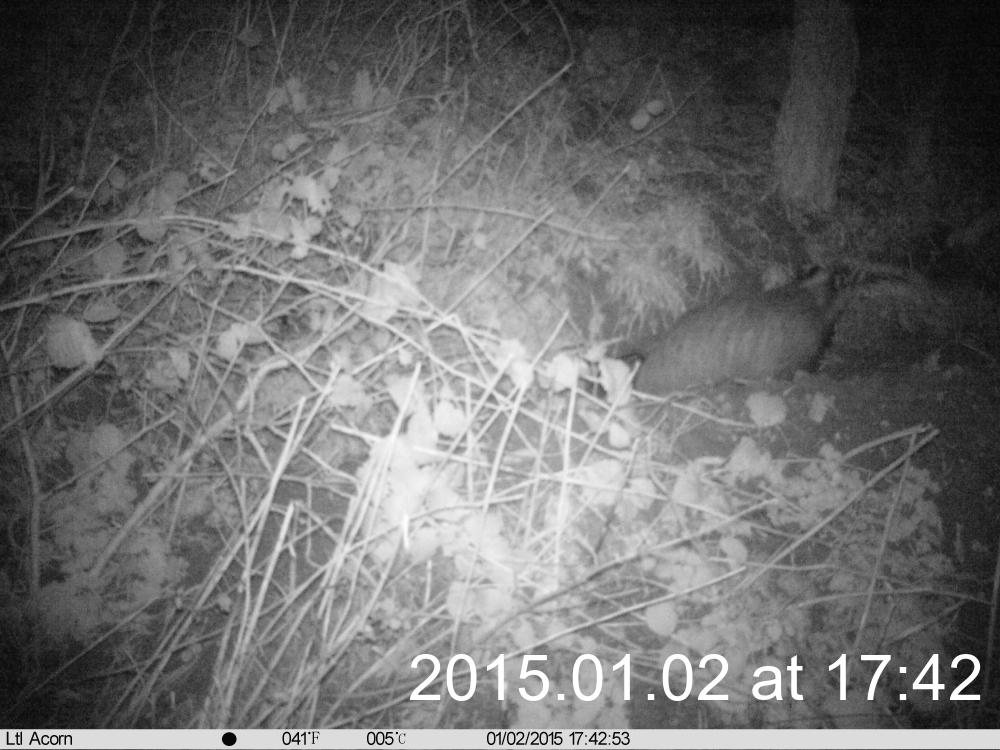
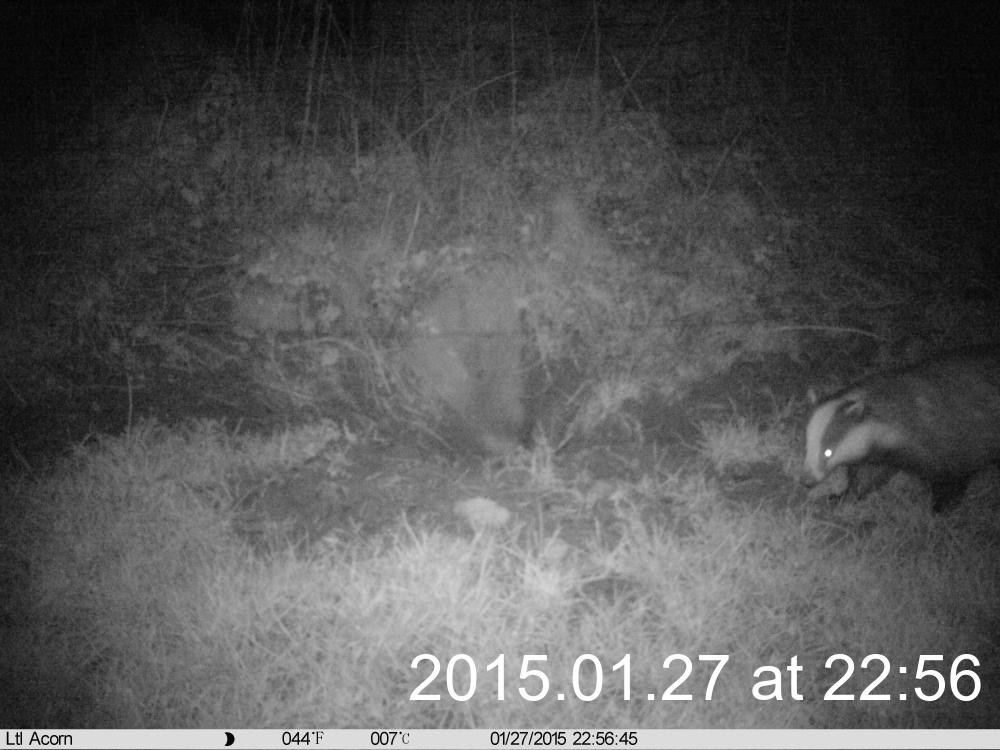
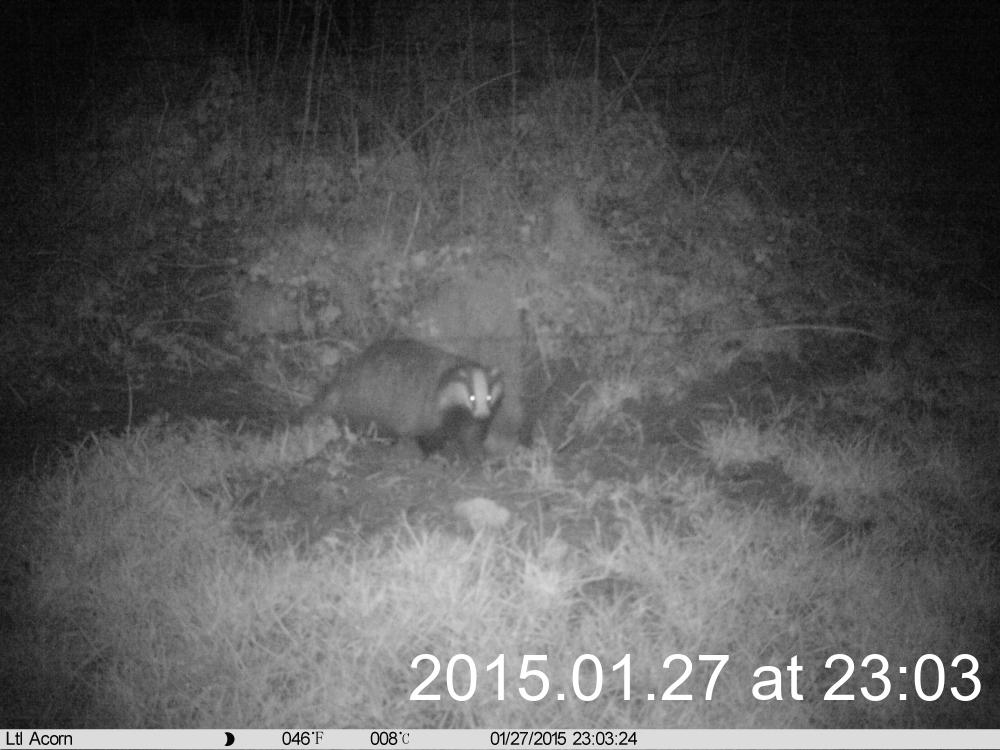
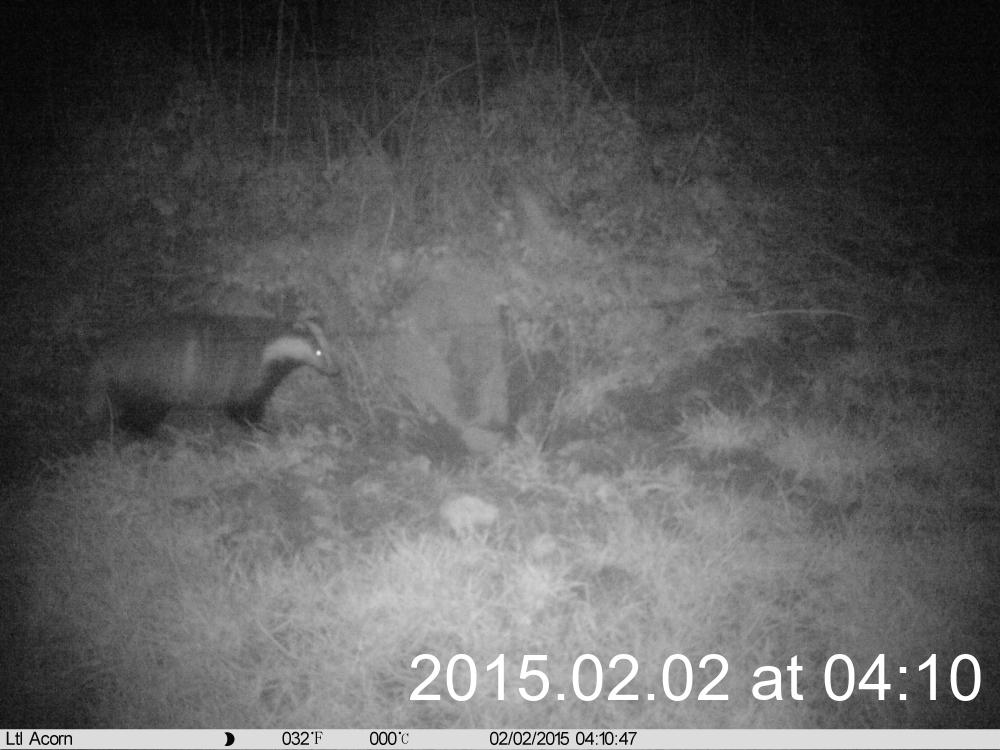
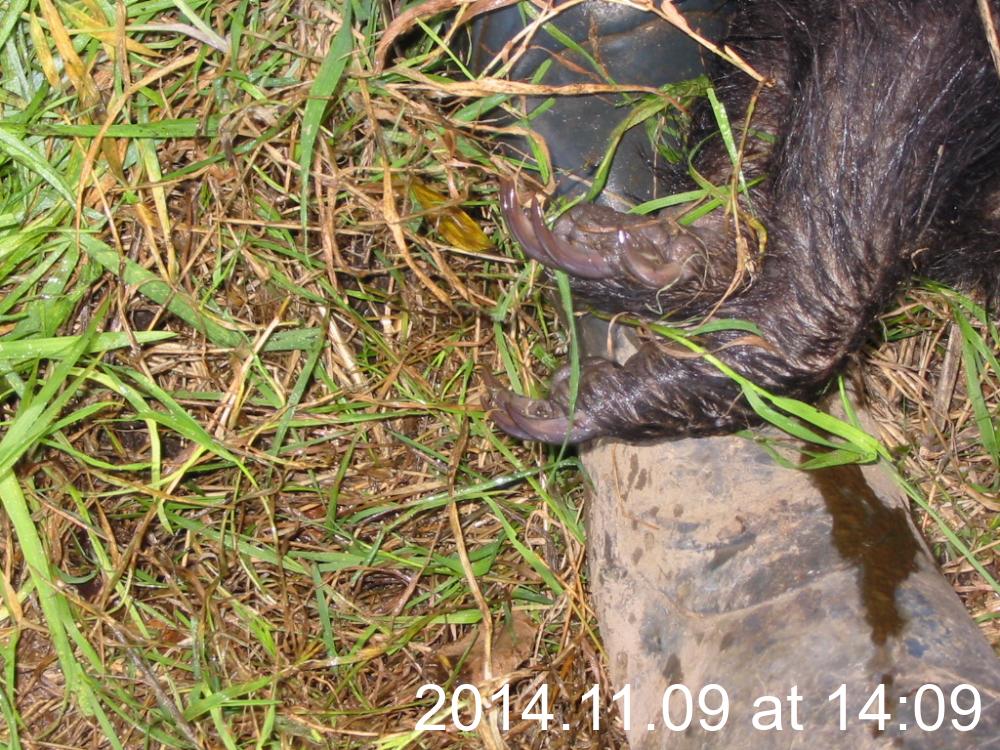
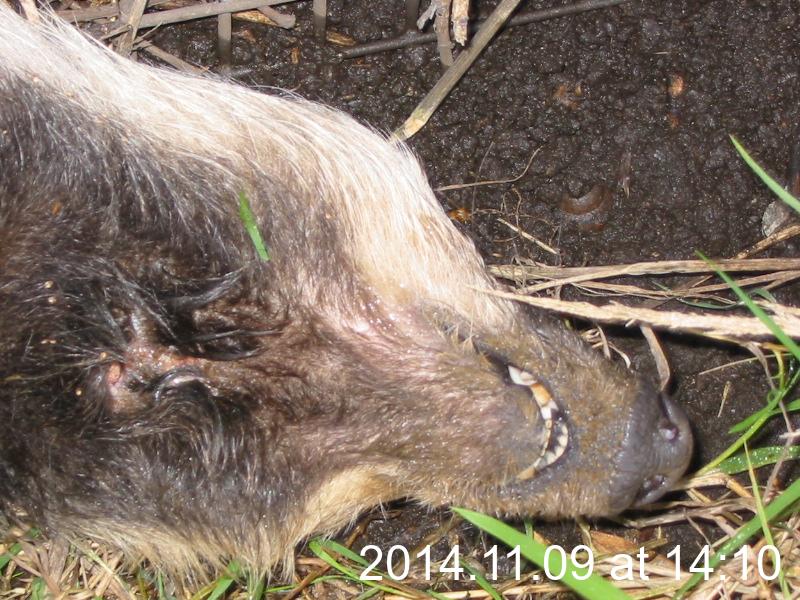
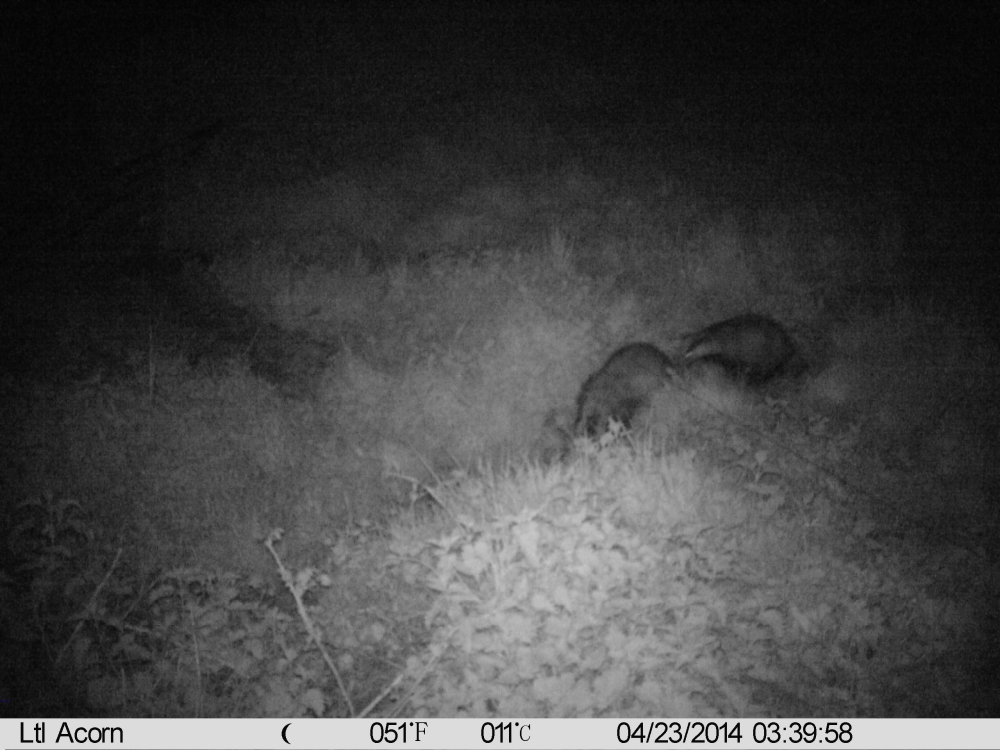
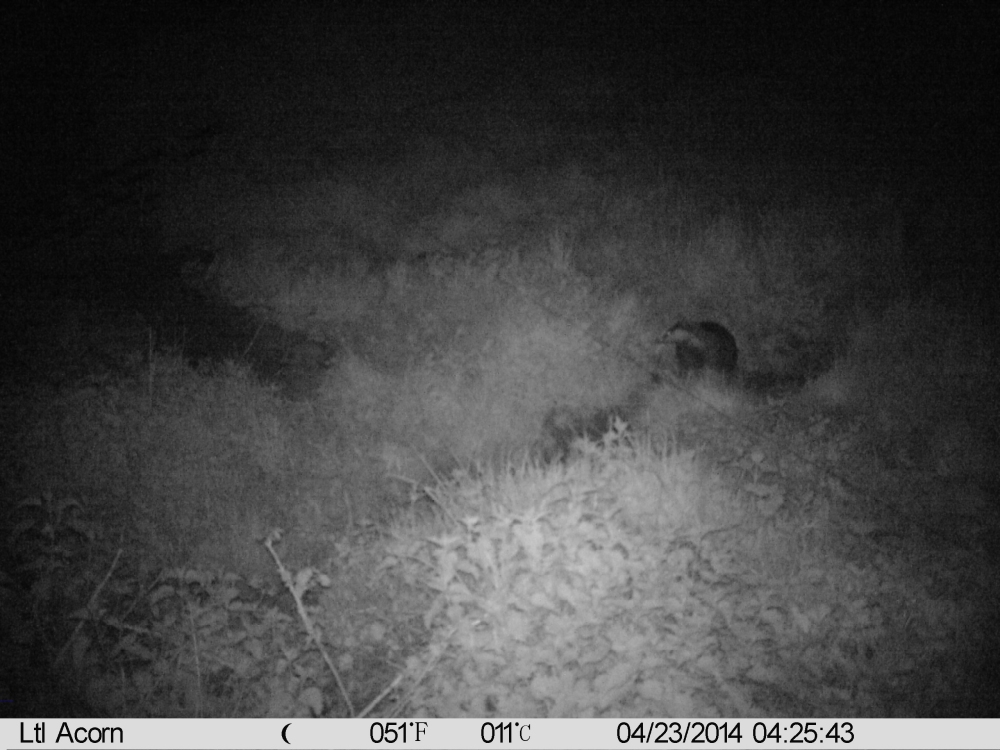
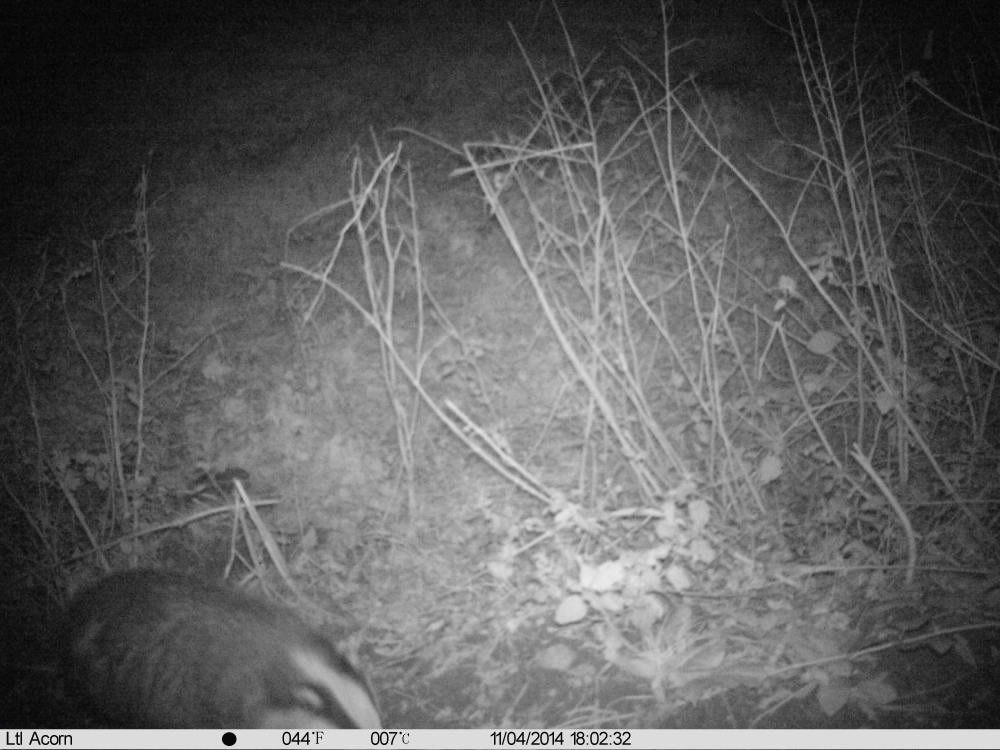
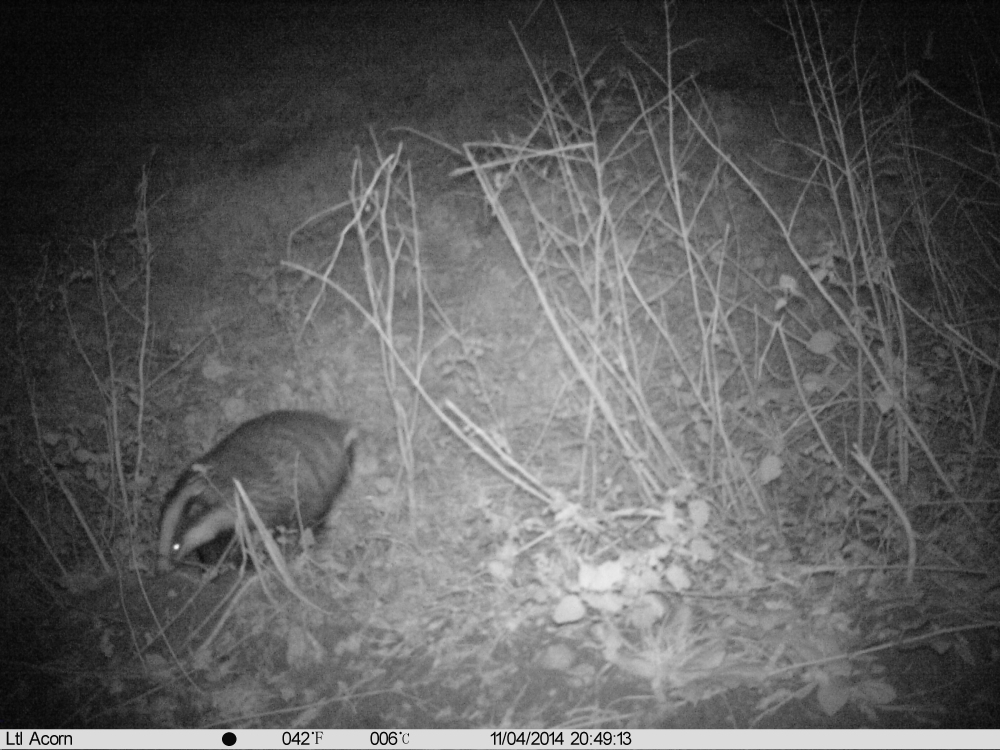
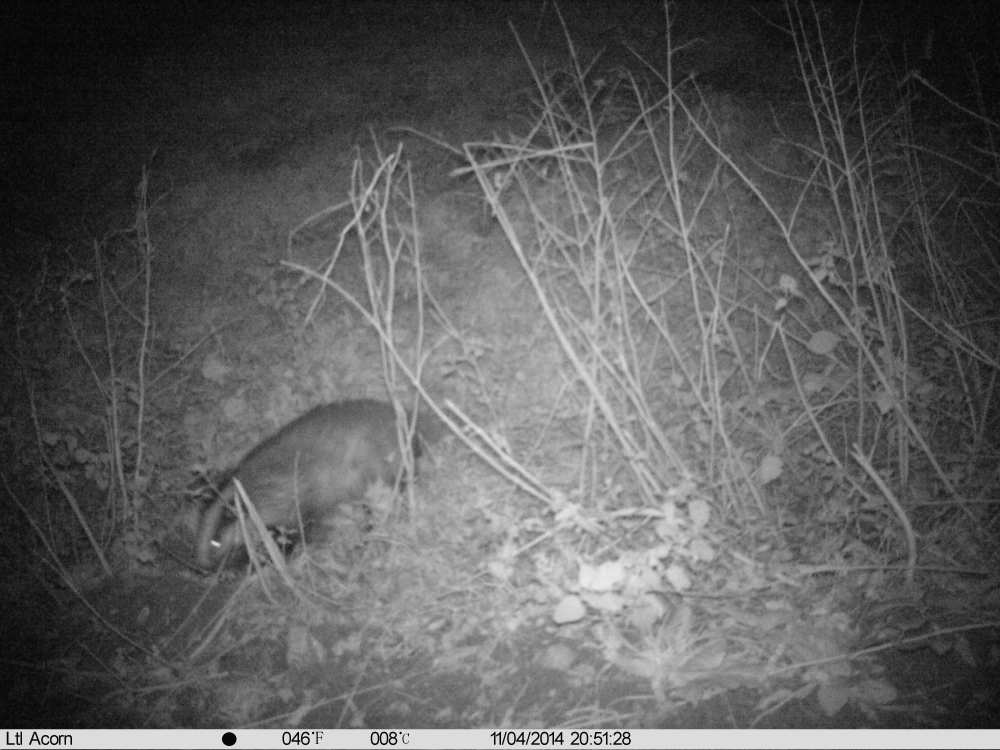
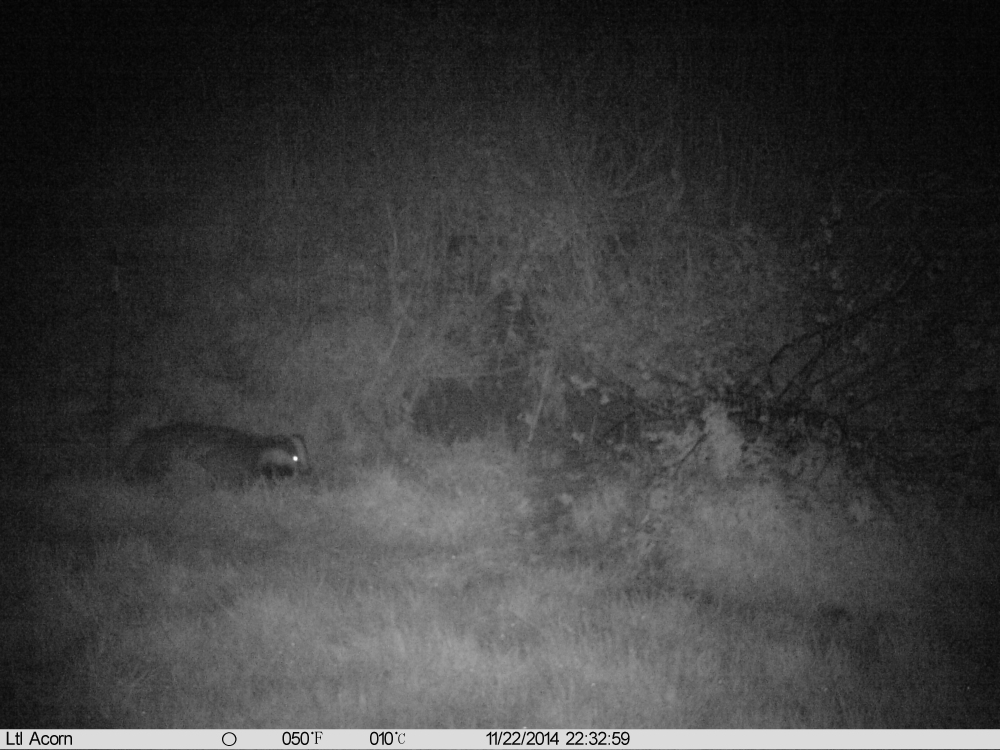
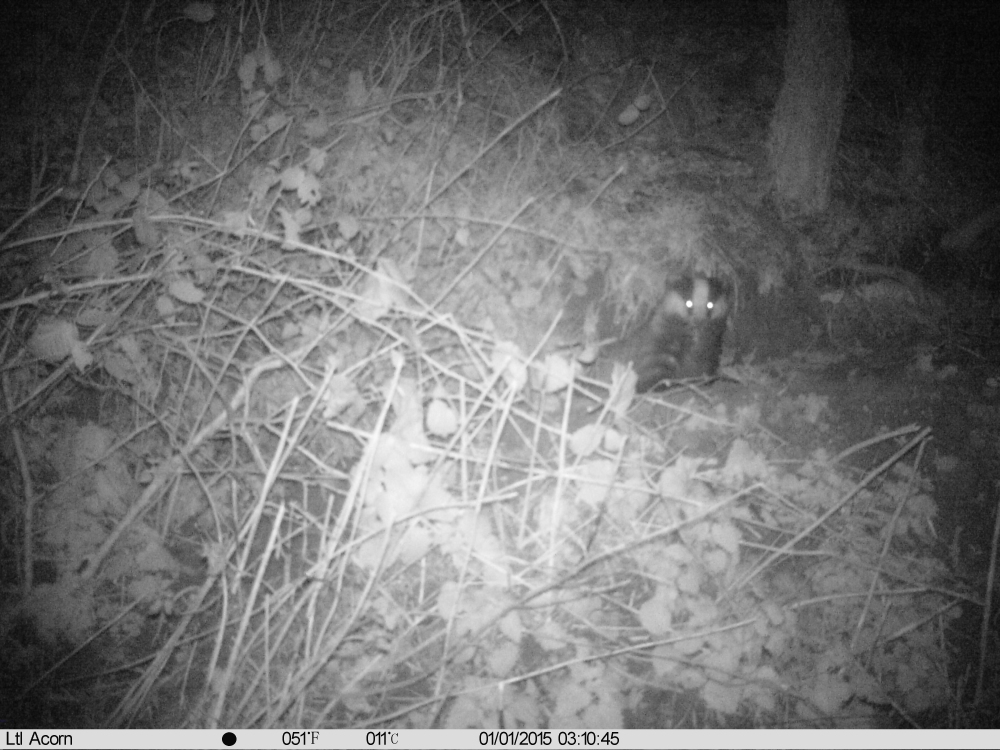
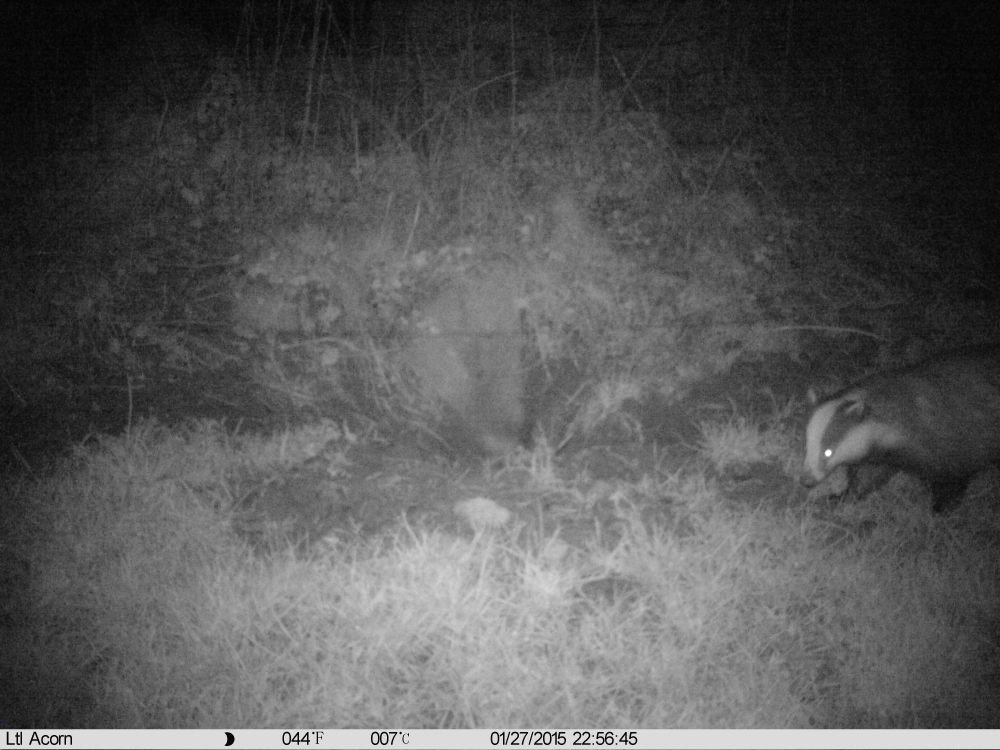
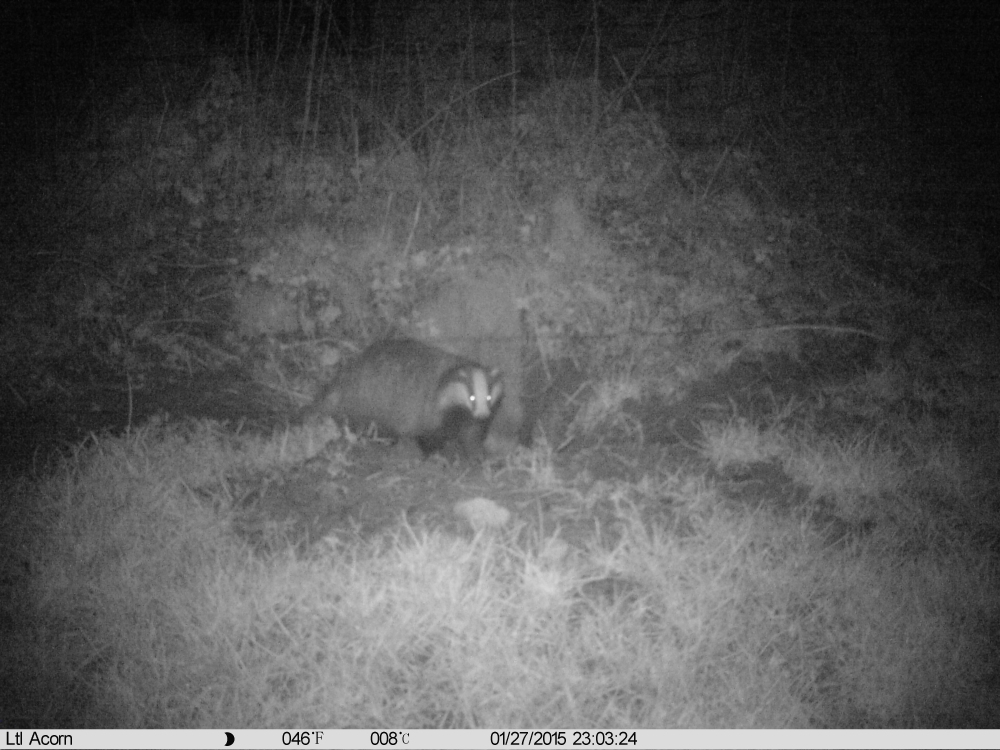
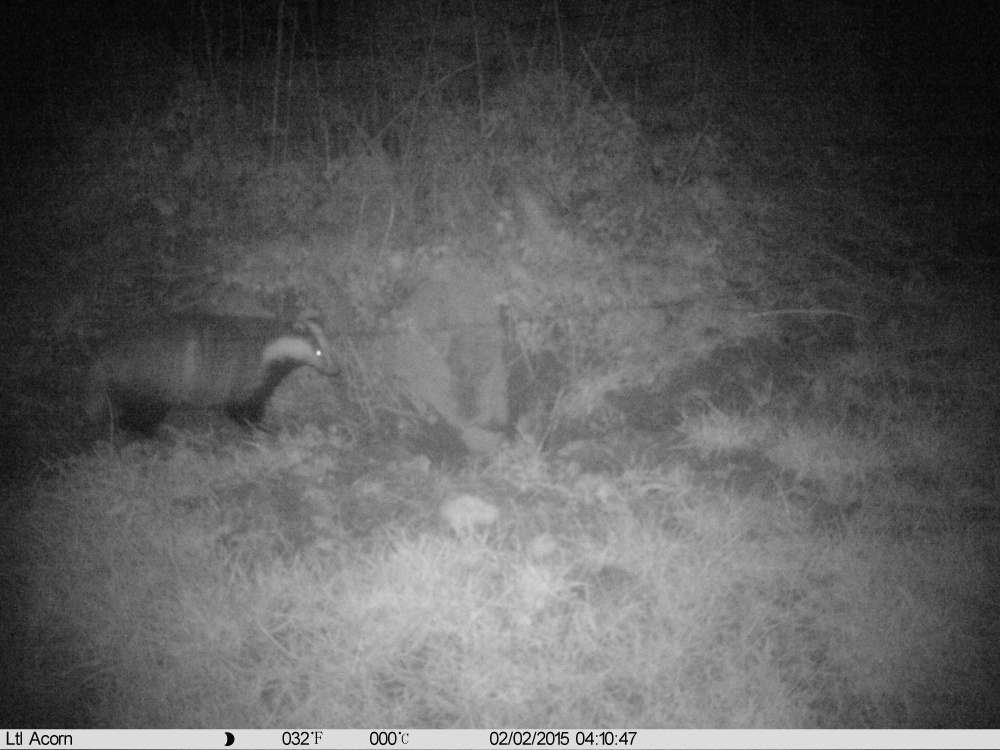
Farmers are finding slow moving, moribund badgers in the same field as grazing stock
On 7th Nov 2014 at 11am in the morning the farmer found a very ill and lethargic badger wandering close to a hedge in a field in which cattle were grazing. All the cattle were immediately rounded up and housed for winter that same day. Shown below are thumbnails of badgers photographed on the farm in the same field as the sick badger. Notice that some of these pictures were taken 2 or 3 days before the sick badger was found. It is possible that the sick badger had recently been ejected from a sett which is shown in these photographs.The farmer then found the following sick badger wandering in a field next to his farm buildings the next day during daylight on 8th Nov 2014.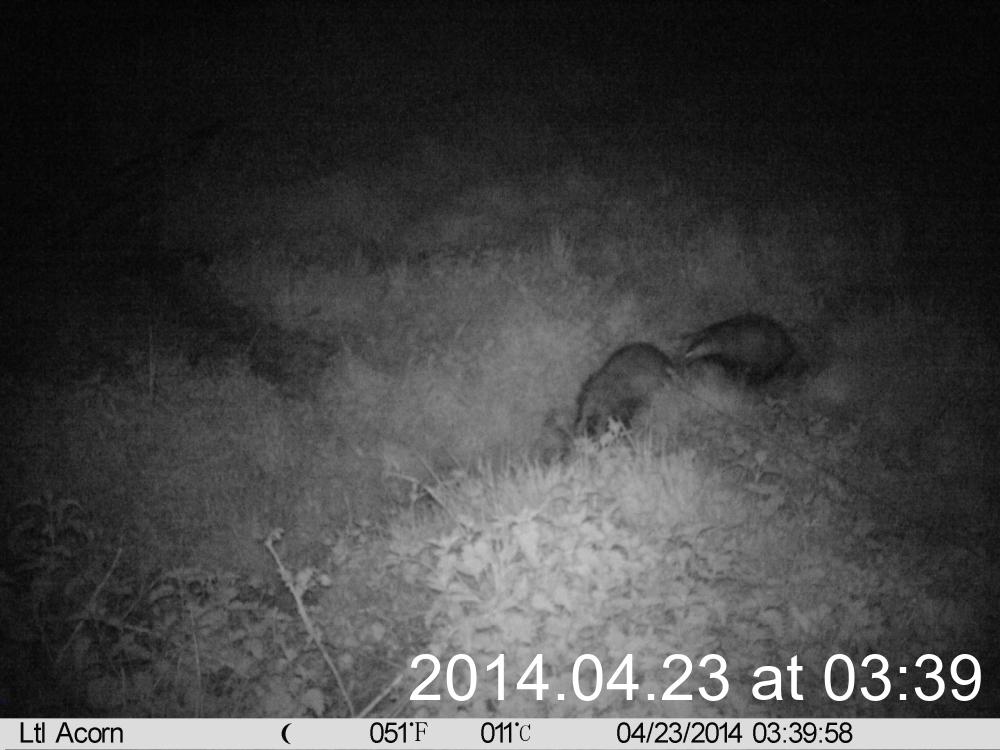
-
Slow moving, moribund badgers at pasture will most likely draw cattle in as was found with sedated possums in New Zealand
The following videos show cattle interacting with sedated possums. The first video refers to the use of a stuffed badger to draw cattle in and the second video illustrates how possums draw cattle in.
Inquisitive cattle encountering slow moving badgers moribund with TB may be a route by which TB is being transmitted from badgers to cattle at pasture.
-
Although biosecurity and measures to keep cattle and badgers separate helps, some farms as illustrated above and below can still be badly affected by bovine TB
Although securing buildings against badger intrusion most likely helps, it is often impractical to achieve separation at pasture. This is probably why farmers who run closed herds with exemplary biosecurity but graze their cattle during the summer still find that their herds are frequently going down with TB.
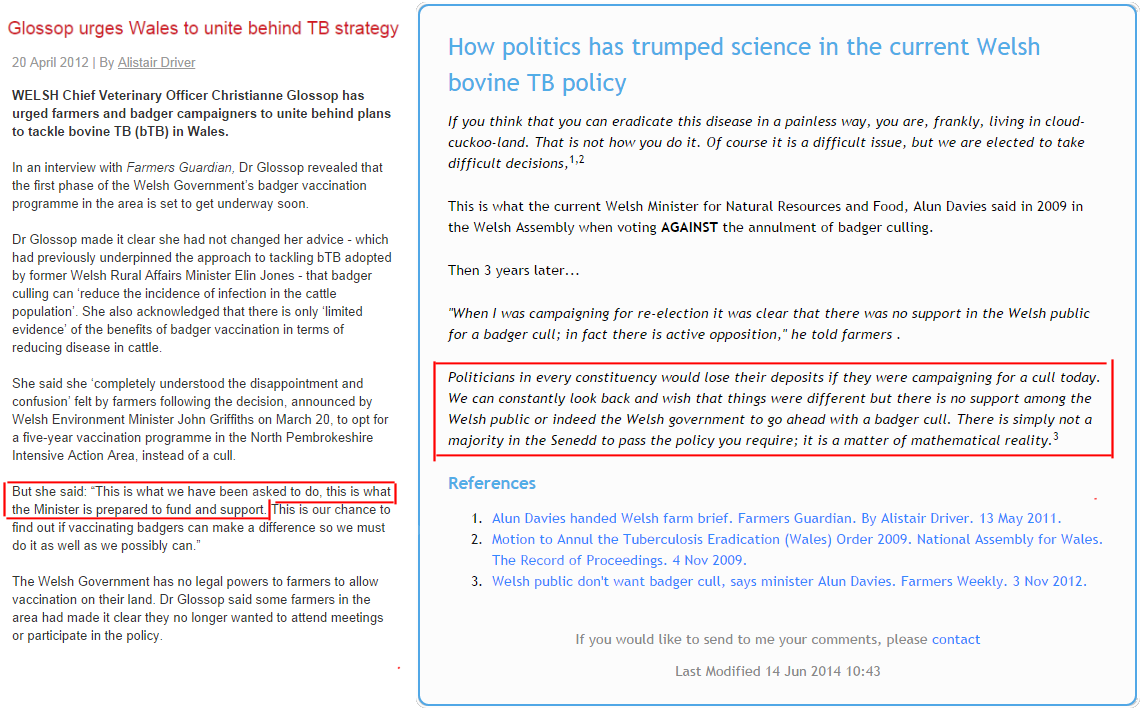
On 8th October 2013 Farmers Weekly Interactive reported that Christianne Glossop the Chief Veterinary Officer for Wales reported the plight of a farm manager as follows.98
The Gelli Aur college dairy farm in Carmarthenshire was a typical example of the current problem.
Its farm manager, John Owen, has been grappling with TB for the past five years and has seen 400 cattle slaughtered due to TB, she explained.
She was also quoted as saying the following.
"The farm cat died of TB. They have been subject to 60-day testing, been fully compliant with all the rules and regulations and have very good biosecurity. Yet they are dealing with that problem for all that time. That's not unusual."
- Farmers are leaving the industry because of bovine TB
Farmers in TB hotspot areas are finding it difficult to survive because of
- the disruption, inconvenience and cost of implementing biosecurity such as sealing buildings as illustrated above for which no compensation is received from the government
- the rigors of bovine tb testing every 60 days when a herd is infected
- loss of irreplaceable bloodlines
- the limited market when selling unslaughtered stock from a TB restricted herd
- the thought of turning out cattle into summer pastures which may be overrun by badgers
These issues are accelerating the rate at which farmers are leaving the industry.
- An annual levy of £1 on each bovine farmed in the UK would raise a revenue of just less than £10m each year.
According to a cattle and calves dataset annually updated by DEFRA, 9.8 million cattle and calves existed in the UK in 2013. If a £1 levy on each bovine each year was raised, this would raise an annual revenue of just less than £10m. If this fund was to be properly managed104,105, this fund could be used to fund substantial and badly needed areas of work which are not currently receiving attention by government ministers who are responsible for the way in which public funds are channelled. In my view one such area in need of better support is in the developemt of a badger culling method which is suitable for implementation.
- In 2014/15 a net income of £56.5 million was derived from levy submitted by the agricultural industry.
The following shows an extract taken from the AHDB Corporate Plan 2014/17.106
The forecast total net levy for 2014/15 amounts to just over £56.5m and this is supplemented with grants and other income forecast to be in the region of £2.8m. The funds raised from each commodity sector are ring-fenced to ensure they are used to the benefit of the sectors from which they were raised.Industry Sector Forecast net levy income 2014/15 Pigs in England £8.825m Beef and Lamb in England £15.160m Milk in Great Britain £6.920m Horticulture in Great Britain £7.850m Cereals and Oilseeds in UK £11.609m Potatoes in Great Britain £6.202m Grants and other income £2.839m Total net income £59.405m -
There are no plans to form a team dedicated and answerable to the farming industry regarding the control of bovine TB
In response to a query to the Agriculture and Horticulture Development Board (AHDB) asking if there was any intention to set up a TB Eradication Group which would advise farmers, the response was as follows.
... Historically levy boards have been discouraged from being involved with the TB issue as the debate has been a political one and best handled by trade associations ...111
The bad press which badger culling is receiving is causing this important and crucial aspect of TB control to be hived off to the National Farmers Union. The NFU have no obligation to respond to Freedom of Information requests. In addition to this, DEFRA may be failing in its duty of care to audit the NFU properly.116
- Out of Northern Ireland, Wales, the Irish Republic, New Zealand and England, England's dairy herd numbers have reduced the most rapidly in the ten years leading up to 2008.
The rate at which dairy herd numbers are reducing each year gives an indication of the rate at which dairy farmers are leaving the industry. Out of Wales, Northern Ireland, the Irish Republic, New Zealand and England, the greatest reduction since 2000 is seen in England.Data for the above graph was sourced as shown below.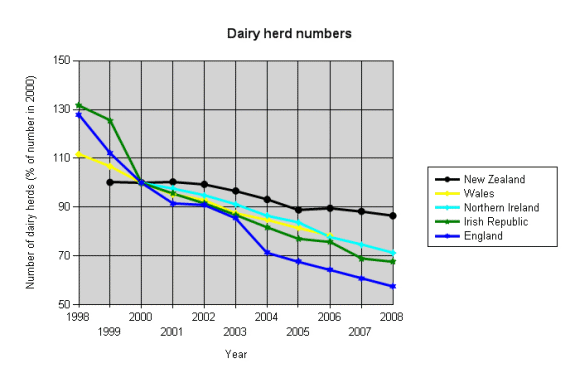
New Zealand Request (Sent 09Apr09) Reply (Received 14Apr09) Received data Wales Request (Sent 09Apr09) Reply (Received 27Apr09) See reply Northern Ireland Request (Sent 09Apr09) Reply (Received 27Apr09) See reply Irish Republic Request (Sent 09Apr09) Reply (Received 29Jun09) Received data England Request (Sent 09Apr09) Reply (Received 07May09) Received data - At the current rate of decline, the majority of current dairy farmers may have left the dairy industry before the first positive affects of badger vaccination are seen
The British Cattle Veterinary Association14 said in July 2008 that Bovine TB vaccination will not be effective in badgers for the next 12 years. If this prediction turns out to be true, the graph below shows that this will be too late for the majority of farmers at the current rate at which they are leaving the industry.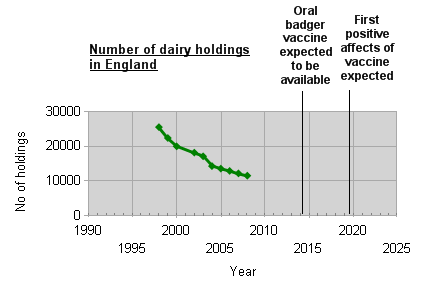
- Between 1994/95 and 20010/11, milk production in Wales, Scotland and Northern Ireland has increased whereas production in England has clearly reduced
England has approximately 10,000 dairy farms. In Scotland, Wales and Northern Ireland there are a further 6,000.38 Between 1994/95 and 2010/11 milk production in Wales, Scotland and Northern Ireland has increased whereas production in England clearly reduced.
To see a graph of how England's milk production has reduced in relation to that of Wales, Scotland and Northern Ireland, please click here.
Such data was sourced as shown below.Out of England, Wales and Scotland, milk production to the economy makes the least contribution in England as shown in the table below.Milk production Request (Sent 15Apr09) Reply (Received 05May09) Received data Country Milk production
in 2007
(Billion litres)32Gross Value Added
in 2008 (£bn)59Contribution which
milk production
made to GVA
assuming an average
milk price of 25 ppl(%)England 8.7 1081.4 0.20 Wales 1.4 45.6 0.77 Scotland 1.3 108.8 0.30 In March 2009, milk production in the UK reached a 35-year low.31 In October 2008 Ireland, Germany and Italy were heavily fined for over producing whereas production in England was well under quota.13 The milk quota deficit in the UK will present export opportunities for neighbouring countries, particularly in the case of Cheddar cheese39.Cheese is the UK's largest dairy import category. In fact the UK is one of the largest markets for cheddar in the world and UK cheese production is expected to decline over the next 5 years (to 2015). Reference 39, which was published in September 2009, presents a revealing and detailed picture of the state of world markets in dairy products.
- In 8 years since 2000, the UK's trade deficit in milk and dairy produce has steadily increased from £500m to £1,200m.
trade deficit = imports - exports
The following graph shows how the UK's trade deficit in milk and dairy products has increased since 1990.The figures were reported by DairyCo50 to be sourced from Customs & Excise and are shown in the following link labelled "Received data".Trade Deficit Request (Sent 10Jun11) Reply (Received 13Jun11) Received data


Good questions to ask
- Why is the incidence of bovine tb in the UK and Ireland more than 5 times23 greater than in any other European country?
- In all but 3 years in the last 20 years (up to 2006), the incidence of bovine tb in Great Britain has significantly increased each year and there has been a very large increase in the last year (2008). Why did the proportion of cattle reacting to the tb test in Great Britain reduce by a factor of 4 in just 5 years after 1960? How was this achieved and why can we not do this now?
- How has New Zealand been able to reduce the number of infected herds from 1500 to 150 in 10 years since 1994? (These numbers were read off a bar chart in the Government Veterinary Journal.)
-
Until recently, out of England, Wales, Northern Ireland and the Irish Republic, England was the only country which was not looking at reducing badger numbers as part of its bovine TB eradication plan.
On 7th July 2008 Hilary Benn issued a statement saying that badger culling cannot meaningfully contribute to the future control of cattle TB. Prior to making this statement Mr Benn referred to the Randomised Badger Culling Trial (RBCT) which was overseen by the Independent Scientific Group. He observed that bovine TB increases outside a culled area due to disturbance and movement of badgers. Work which followed on from the RBCT, and which was funded by Defra and published on 9th April 2008 continued to monitor herd breakdown incidences after culling stopped in October 2005. This work11 found that breakdown incidences were 54% lower in culled areas, instead of 23% lower as reported in the RBCT, and that in neighbouring areas where the negative affects of perturbation were seen, incidences were actually 23% lower instead of 24% higher. In other words, after culling ceased, incidence reductions were sustained. In fact radical benefits were seen in both the culled and adjacent areas. In fact data published in April 2011 showing data up to February 2011, which is 5.5 years after culling stopped, shows that in the treatment areas herd incidence is still 37% lower than that in the survey-only areas.60
In view of this, how can it be said that badger culling cannot meaningfully contribute to the future control of cattle TB? -
In the Final Report of the Independent Scientific Group on Cattle TB27 it says "we have concerns,
previously expressed, concerning the capacity of Defra policy groups to translate scientific
findings into policy. This we consider stems, in part, from Defra's own organisational
structures which we believe enforce a separation of policy development and the scientific
evidence on which policy should be based."
Is the decision on badger culling an example of where scientific findings do not properly translate into policy? Please click here for more detail. -
In South Devon, a farmer found in 2008 that his whole herd cleared the test for tb only then to find that cattle slaughtered after clearing the test exhibited tb lesions. Conversely, it was reported18 in May 2008 that a farmer of pedigree guernseys suffered the slaughter of 80 cows to then find that only 5 showed symptoms during examinations after slaughter. How much is the government spending on improving the sensitivity and accuracy of testing techniques compared to the bill of £ 60m19 which the tax payer is paying each year for routine testing and compensation?
It should be noted however that if the disease is not found in a post-mortem examination the animal may still be infected. Click here for an explanation why.
The proportion of false negative and false positive results when TB testing, and a request to and response from DEFRA regarding this, is shown here. - Why is the cost of a TB test three times greater in England than it is in New Zealand. Please click here for details.
- Milk production in the UK in March 2009 was the lowest it has been for 35 years.31 In addition to this the average age of dairy farmers is now 60.20 Has the government properly looked into the repercussions should the supply base shrink further, processing plants close and hard-to-create infrastructure is lost?
- Vaccination of badgers by injection will be difficult and expensive to administer.
An oral vaccine for badgers is not expected to be available until 2014. [Editor note added on 13 January 2015: This did not happen.]
In fact the National Trust in the BBC April 2011 announcement to vaccinate badgers on its estates said that it will be injecting the vaccine.
Although in theory the vaccination of cattle may offer the most expedient solution, it is illegal by European law. In fact, EU legislation currently prohibits the use of bovine tuberculosis vaccines, as the use of injectable BCG vaccine for bovine tuberculosis in cattle interferes with the current tuberculin skin test. Changing such legislation will require successful negotiation with the Commission in Brussels and other member states.26
How does the government believe it is going to be able to legalise the vaccination of cattle when 11 European countries have in recent years been bovine tb free?23 - In 2009/10 the tax payer paid £87 million58 to address bovine TB in Great Britain. By how much does this cost need to rise or what disease development needs to occur before it is universally accepted that a comprehensive and robust set of measures is needed to reduce bovine TB?
When did things start to go wrong?
Farmers in high incidence areas of England are now being asked to foot the bill for culling badgers when in 1986 it was decided not to continue funding the clean ring strategy because it was deemed to be too expensive.The 'clean ring strategy' was introduced in 1982 and involved cage trapping badgers on land occupied by affected cattle herds, then on adjoining land, expanding outwards until no further infected animals were captured.
In 1986 this approach was replaced by the 'interim strategy' which involved culling badgers only on land occupied by affected cattle herds. The last 'interim' culls were performed in 1998, prior to the start of the badger culling trial known as the RBCT.
This 'interim' strategy was recommended and implemented because a cost-benefit analysis showed the high cost of the clean ring policy could not be economically justified.
What a mistake!!
Many farmers in high incidence areas are now leaving the industry partly due to the expense and lingering hardship associated with bovine TB.
In 2000, according to Customs & Excise, the annual UK dairy trade deficit was less than £0.5b. In the ten years since then the deficit has steadily increased so that in 2010 the deficit exceeded £1.2b.
What is seen as the future for farming in South West England and what are the reasons behind this distinct lack of willingness to allocate the necessary resource and commitment to address bovine TB in this country?
There are two reasons why the burgeoning badger population is not being addressed to achieve TB free status. One is the government's unwillingness to make a commitment and put serious investment into achieving a long term aim. The other is loss of votes in the face of a misinformed public who do not understand the reasons why UK field trials of cattle vaccination are being stalled and why badger vaccination is currently seen as an unproven, distant solution for which the first stage in badger trials on an oral vaccine in the Republic of Ireland have yet to be published [This was current on 13 January 2015].
Ways forward
Current strategies are not working. Bold measures are needed to bring benefits in a timescale which will help the current industry.- If disease eradication is the goal, one option would be to change the legal status of badgers to match that in the rest of Europe.74 This will bring about a large reduction in the size of the badger population. As the size of the problem continues to grow, pressure to remove protection status will increase.
- The farming industry must take on more of the financial burden. In tackling bovine TB, New Zealand are widely regarded as being world leading. However New Zealand did not start to get on top of their problem unitl farmers took control of the problem. In order to achieve this, the farming industry must be prepared to take on more of the financial burden as was done in New Zealand,83 and become less dependent on state-financed compensation. More importantly, the government needs to review how TB is funded and transfer these costs.
Potential for recovery
Cumbria was by far the worst affected county for Foot and Mouth. In fact so many cattle were slaughtered in 2001 in Cumbria that cattle number was about half what it was in 2000.82 Suspension of TB testing and subsequent restocking to fill the void caused strains of TB which were specific to Devon to appear in Cumbria. The test interval in 2000 throughout Cumbria was 4 years and in 2004 measured levels of TB peaked.82 Disease levels then dropped each year for the next 3 years as a result of annual testing in affected areas. In fact disease levels had largely recovered by 2007 and in Cumbria at the time of writing this (Jan 2015) most of Cumbria in terms of geographical area is still tested only once every 4 years.84 This gives an indication of how effective cattle measures can be in the absence of a wildlife vector and why it is so necessary to eliminate the wildlife vector in the South West of England and Wales.Future prospects, the need to act now, and lack of support from DEFRA
Bovine TB has the potential to cripple cattle farming in the UK. More than 95% of commercial dairy herds which have existed since 1990 have been TB restricted in the worst affected counties in South West England.86 Dairy enterprise setups depend on the continual sale of young stock to maintain running financial capital. If a restricted dairy herd fails to go clear after the minimum 4-month period, mounting pressure due to overstocking can lead to formidable stress. The combined impact of- inability to sell stock at unrestricted markets,
- escalating feed prices from over-stocking,
- increasing workload as unsold stock accumulates,
- reduced income, and
- inability to plan due to uncertainty over the next test result
Both DEFRA and the NFU exclusively quote the results of the RBCT badger culling trial from which it is estimated that at best a 16% benefit in terms of reduced TB can be expected over a 9-year timescale if the cull takes place in a 150km2 area.92 In the last 9 years, TB in terms of both cattle and herd incidence has increased by 65% as shown in Fig 100 below. As such, for a cull area of 150km2, if no other factors change except for the culling of badgers, TB incidence can be expected to continue to climb substantially even if the expected benefit of culling is achieved. It should be noted that the 2 pilot areas in West Gloucestershire and West Somerset measure 311km2 and 256km2 respectively.99 However if account is only taken of what happens inside the cull area with no account for the negative impact outside it, the upper limit to the benefit is still only limited to about 27%.92
It should be noted that Fig 98 below shows total herd incidences (confirmed + unconfirmed). In order to reveal more clearly the impact of culling, results presented in the RBCT analysis use confirmed incidences only.97 In fact if confirmed incidences for the Thornbury exercise are examined only, no incidences occurred from 1981 to 1991 i.e. for 10 years after culling stopped.96
It is believed that this substantial impact was principally due to the culling of badgers. In fact Section 5.77 on Page 114 of the RBCT Final Report27 states that culling was very likely to be the reason for the reduced cattle TB incidence inside the gassing area. Also when questioned by Owen-Paterson in 2004, the then Under Secretary of State for DEFRA, Ben Bradshaw, replied as follows.91
No other contemporaneous change was identified that could have accounted for the reduction in TB incidence within the area.
However both DEFRA and the NFU are ignoring what has happened in the Thornbury district.
When DEFRA quotes expected benefits based on the partial culling carried out in the RBCT it affectively says to the British public, that in future policy, badger culling cannot play a big part in TB control and that bigger gains will be had through looking at other issues. Judging by comments in the media, this is what a large proportion of the public believe, and this is of course very understandable in view of the information which DEFRA and the NFU are putting across to them. In fact in August 2014, Nigel Gibbens, the Government chief vet, insisted that badger culling was only a small part of the overall strategy.112
But how can an area be thoroughly culled and then left for badgers to recolonize when the Bern convention forbids it? Does it forbid it? This is open to interpretation. In the convention, there is an exception that allows for the regulated management of wildlife for the purpose of preventing serious damage to livestock provided this is not detrimental to the survival of the population concerned.93,94
In addition to this, DEFRA are not prepared to take responsibility and play an active part in culling badgers. They are leaving this to farmers who neither have the time, the organisational structure, nor the mustered resource to carry out this challenging role properly. As illustration of a vital role which DEFRA are not taking towards bovine TB control, on 24th June 2013, DEFRA replied to a request90 under the Environmental Information Regulations Act saying there were no research and development projects investigating alternative culling methods to free shooting, and as such no trials of alternative culling methods were being run.
Not all governments are giving their cattle industry low priority. In fact, the Irish government places food at the heart of an export led growth strategy.87 Indeed Ireland are looking to significantly increase milk production in the next 10 years.88 TB can have a dreadful impact not only on dairy farms but also on beef farms and farms with other farmed cattle. However, if Ireland makes a serious attempt to increase its milk production in the next 10 years, the weak measures outlined in DEFRA's recently announced draft strategy89 coupled with DEFRA's drive to redirect CAP funding from Pillar 1 to Pillar 2 will only help to turn Ireland's ambition into reality. This will be helped by the shrinkage of a TB-restricted and CAP-disadvantaged dairy industry in England and Wales.
The bottom line
Governance of strategy for controlling TB is critically important and is very rarely discussed. Governance is important because a game changer is needed to make the government focus on controlling TB and this may never happen. An example of what is needed to make this happen is if cats, dogs or humans start going down with the disease in numbers. If surveillance can be assumed to be adequate (big assumption?), it is fortunate that this is not happening. However this means that very little action is currently being taken to address the current and worsening situation regarding the spread of bovine TB across England.In essence, effort has to follow the money as is clearly illustrated by the statement made by Dr Christianne Glossop in this link . If there is no money, there will be little effort.
The reason why ministers currently set strategy is because they are responsible for how money in the public purse is spent. As such governance will not change until funding moves away from the public purse. Farmers are the only people who actually need TB controlled and governance will not go to farmers unless they fund the work. If funding was to change, the management network and terms of engagement which are set up in order to manage operations will be critical. As found in New Zealand, until both the funding and network are in place and set up correctly, progress will not be made.
Unfortunately current prospects for farmers in the UK taking control are bleak. The following is a quote100 from Dr Paul Livingstone who is TB Eradication and Research Manager of the New Zealand program.
...from my understanding of the UK situation, UK farmers don't appear to want to be involved - especially don't want to pay. Once farmers accept that they should pay, then they can start having a say in the form of the programme. From the New Zealand experience, it wasn't until farmers started paying and taking responsibility for the programme that it started making progress.
Details of the steps which New Zealand took to cause their TB levels to plummet and the order in which the crucial initial steps were taken are given here.
What the UK needs to do to reach TB free status
Although the UK's problem is somewhat different to that of New Zealand's, not least because the UK's principal wildlife reservoir is in a native species whilst that in New Zealand is in an introduced pest, broadly three things need to happen in the UK before the current worsening situation can be turned around. These are as follows.Firstly, it is inevitable that farmers will need to contribute a greater share of the finance. It will be impossible for farmers to steer the programme and take politics out of the driving seat if they do not finance it. However cattle farmers are already paying a substantial levy each year. The forecasted levy income from cattle farmers for 2014/15 to the Agriculture and Horticulture Development Board (AHDB) from Great Britain (Dairy) and England (Beef and lamb) is about £22 million.106 Of this, £36,000 is being used to control TB.108 This is for a long term, partly public-funded project (genetic resistance of cattle to TB) which may be of no, or very little, benefit to farmers who are paying the levy. This situation does not make any sense. TB is currently one of the biggest problems facing the cattle industry. Why are so little of the funds submitted by farmers being channelled into addressing TB and why is the existing program not looking at reducing TB in ways which are more aligned to what farmers need? According to DairyCo, which is a division of the Agriculture and Horticulture Development Board, this TB program was discussed with the NFU, The Bovine TB Eradication Advisory Group and DairyUK.108 In my view, the TB program needs to be accountable to farmers rather than just discussed with an elite few.
Secondly, a dedicated and properly resourced team needs to be set up which is solely responsible for reducing TB. Both the NFU and individual farmers have other commitments. There is already a Bovine TB Eradication Advisory Group for England (TBEAG) but the job of this group is to advise ministers. This means that the role of the group is to satisfy the aspirations and needs of government ministers who are hamstrung with the need to placate a general public for whom bovine TB is a minor issue. A group needs to be set up which serves the needs of the farming industry who need TB controlled. As such a group is needed which is independent of government in terms of legislation as is TBfree New Zealand. (TBfree New Zealand is a subsidiary of OSPRI). The group in England (or perhaps Great Britain) should report to farmers, set targets, and be responsible for hitting these targets. It should be responsible for monitoring, reporting and reviewing progress, and be accountable in terms of how funds are spent and how targets are met. In order to achieve these goals, New Zealand's TBfree team (formerly directed by the Animal Health Board) from the start included a small number of paid staff whose performance and salary are reviewed each year by an independent outside organisation.
Thirdly, the government's intent must change. Currently much effort goes into pacifying and mollifying the general public. Effort needs to be redirected into actually looking at ways of reducing TB for today's generation of farmers. In order for programmes aimed at developing cost-effective and practical means of controlling TB to come to fruition, the government will need to set up an environment which is conducive to farmers playing a leading role to control TB. For example the government will need to overhaul the way in which TB control is funded. It will then need to play a pivotal role in setting up a TB team which will be responsible for reducing TB. It will finally need to implement a framework which will make it easier to roll out a badger control programme.
The catalyst for change will be when farmers pay the major share and a dedicated TB team is set up whose remit is to reduce TB. The first of these moves will need to be initiated by government and the government will need to be party to the second, so the solution lies with the government. The commitment from UK governments has so far been insufficient to make this happen and the farming industry in each country will only be able to take responsibility when their circumstances allow. This is unfortunate because the New Zealand government took action when the percentage of herds which became restricted at some point during the year due to TB (including unconfirmed) reached 3.5%. This occurred in the mid 90's. In England at the end of 2013 that percentage (which excludes restrictions due to overdue tests) exceeded 13%, in Wales that percentage exceeded 14% and in Northern Ireland that percentage equalled 7.9%. This begs the following question "How bad does the situation need to get in England and other countries in the UK before governments take action?"
Current government advice
The Animal Health and Welfare Board for England (AHWBE) is the principal source of departmental advice to Defra ministers on all strategic health and welfare matters relating to all kept animals in England.117 Michael Seals, the chairman of the AHWBE debriefed the Farmers Guardian118 on what was said in a workshop on TB governance and funding in the Autumn of 2014. The following shows some of the statements which he made.
... not too much should be read into the New Zealand model.
It was necessary to define areas which 'only Government could deliver', such as badger culling.
It has always been about creating what is called the English solution.
Discussions on a compulsory industry levy had not yet taken place.
There is one thing for certain about this particular disease ... ministers are in charge.
When referring to the option of taking out a compulsory industry levy Michael Seals was more enthusiastic about farmers taking out insurance for consequential losses of a TB outbreak.118 Editor note: This outlook is naive and ridiculous because insurers will only be able to cover events over which the person taking out the insurance has reasonable control. After a herd goes through a TB breakdown it becomes very difficult, if not impossible, to take out insurance.
How much will farmers need to pay to fund 55% of the total TB control program?
In England, dairy and beef farmers will now need to pay about £10 per bovine each year. To see how this cost was calculated, please click here. As TB continues to spread, the cost of putting things right will continue to go up.References
- Mycobacterium bovis
- DEFRA Archive: Incidence of TB in Cattle. (The link to this page at http://archive.defra.gov.uk/evidence/statistics/foodfarm/landuselivestock/ cattletb/ index.htm was removed on 20Feb2012 due to DEFRA stating in a personal email that this old page is only being retained pending archiving and removal.)
- Detailed TB Statistics: 1 January - September 2008 (West region)
- Detailed TB Statistics: 1 January - 5 October 2008 (Republic of Ireland)
- Minister Coughlan rejects Badger Trust/ Badgerwatch Ireland Report
- Value for money and policy review - Bovine tuberculosis Eradication Programme (1996 - 2006)
- Bovine TB: Key herd / animal statistics (by county):1998-2008
- Gabriel, Grills & Associates - veterinary practice Ivybridge - Filham Park Veterinary Clinic
- Tuberculosis in badgers; a review of the disease and its significance for other animals
- An investigation of potential badger/cattle interactions including the extent of badger visitations to farm buildings and food stores, and how cattle husbandry methods may limit these.
- The effects of annual widespread badger culls on cattle tuberculosis following the cessation of culling
- Transcript of Hilary Benn's announcement in 7 July 2008 of the policy not to issue any licenses to farmers to cull badgers
- Tough times ahead as milk production sinks to new low. Farmers Weekly Interactive. Thursday 16 October 2008.
- Bovine TB vaccination will not be effective in badgers for next 12 years says BCVA. Farmers Weekly Interactive. Friday 11 July 2008.
- DEFRA Archive: Complete sets of low-level agricultural survey data supplied by DEFRA. (The link to this page at http://archive.defra.gov.uk/evidence/ statistics/foodfarm/landuselivestock/junesurvey/results.htm was removed on 20Feb2012 due to DEFRA stating in a personal email that this old page is only being retained pending archiving and removal.)
- Rural Payments Agency
- Milk production hits 34-year low. Farmers Weekly Interactive. Friday 12 December 2008.
- Pictured: The dramatic moment a prize cow is slaughtered after controversial blood test showed signs of TB
- Breakdown of bovine TB expenditure in Great Britain: 1998/99 - 2007/08 (£ m)
- Dairy farmers driven out of the industry
- Number of TB infected herds in the Irish Republic
- Number of TB infected herds in New Zealand
- Government Veterinary Journal
- Number of TB infected herds in Northern Ireland
- The Way Forward on Tuberculosis (TB)
- Agriculture: Vaccines: 21 Jul 2008
- Final Report of the Independent Scientific Group on Cattle TB
- Eradication of Bovine Tuberculosis in the EU
- EU funding threat over bovine TB
- Animal Health 2006: The Report of the Chief Veterinary Officer
- Dairy AHDB
- UK milk production between 1998 and 2008. England, Wales, Scotland, Northern Ireland breakdown.
- UK milk production data.
- TB Testing Time And Motion Study
- Compensation paid to farmers for Bovine TB
- Bovine TB expenditure for GB 2008/09
- Background to the milk industry
- The Milk Roadmap
- An assessment of the short to medium term outlook for global dairy products
- Benefits of badger culling not long lasting for reducing cattle TB
- Badger Culling Not a Cost Effective Means of Protecting Cattle
- The Duration of the Effects of Repeated Widespread Badger Culling on Cattle Tuberculosis.
- The Duration of the Effects of Repeated Widespread Badger Culling on Cattle Tuberculosis (Copy)
- The costs for a future culling policy must NOT be based on Krebs costings.
- £600,000 study to assess attitudes towards badger vaccination.
- House of Commons Research Paper on Bovine Tuberculosis dated 1st June 1998.
- UK production and consumption of liquid milk from 1973 to 2008
- UK production and consumption of milk products from 1973 to 2008
- DEFRA Statistics: Food and Farming (This link at https://statistics.defra.gov.uk/esg was temporarily made available by the DEFRA statistics team and was withrawn on 23 Mar 2011)
- UK Dairy Trade Balance
- RBCT: The Duration of Culling Effects
- RBCT: Analysis of further data to 2July2010
- Bovine Tuberculosis in cattle and badgers, a report by the Chief Scientific Adviser, Sir David King
- Table 1 in Reference 51
- Does reactive badger culling lead to an increase in tuberculosis in cattle?
- DEFRA consultation Sept 2010: Annex B - Scientific evidence on culling
- Great Britain and Republic of Ireland badger culling trials: An initial comparative study
- Bovine TB expenditure for GB 2009/10
- Regional, sub-regional and local gross value added 2009
- Analysis of further data (to 25 February 2011) on the impacts on cattle TB incidence of repeated badger culling
- National Trust estate giving badgers TB vaccinations
- The effects of annual widespread badger culls on cattle tuberculosis following the cessation of culling - Supplementary Information. HE Jenkins et al. International Journal of Infectious Diseases Volume 12, Issue 5, Pages 457-465. September 2008.
- BADGERS AND BOVINE TUBERCULOSIS - REVIEW OF POLICY. MINISTRY OF AGRICULTURE, FISHERIES AND FOOD. G M Dunnet, D M Jones, J P Mclnerney. March 1986.
- Relocation, Relocation, Relocation - Tb Takeaways.. Sunday, August 08, 2004
- Update on relocation of badgers. Monday, February 12, 2007
- Secret World - Wildlife Rescue - Badger Rehabilitation
- Badger Rehabilitation Protocol. March 2003
- Badgers and Bovine Tuberculosis 2009 by the Mammal Society
- Gassing of badger setts
- Number of TB-infected herds in New Zealand in November 2011 was at an all-time low
- Bovine TB: Expenditure for 2010/11 in England
- Bovine TB: Expenditure for 2010/11 in Wales
- Bovine TB: Expenditure for 2010/11 in Scotland
- The conservation and management of the European badger (Meles meles). Nature and environment, No. 90. Council of Europe. Authored by H.I Griffiths and D.H Thomas. 1997.
- The History, Distribution, Status and Habitat Requirements of the Badger in Britain. Peterborough; Nature Conservancy Council. Authored by P Cresswell, S Harris and DJ Jefferies. 1990.
- Protection of Badgers Act 1992 - Licensing statistics
- Effectiveness of Biosecurity Measures in Preventing Badger Visits to Farm Buildings. Johanna Judge, Robbie A. McDonald, Neil Walker, Richard J. Delahay. 2011.
- Southwest TB Farm Advisory Service - What we offer.
- Bovine TB: a review of badger-to-cattle transmission. Adrian R. Allen, Robin A. Skuce, Stanley W. J. McDowell. 31 March 2011.
- Bovine TB: a review of badger-to-cattle transmission. Adrian R. Allen, Robin A. Skuce, Stanley W. J. McDowell. 31 March 2011.
- Transmission from badgers to cattle in farm buildings
- Impact of Foot and Mouth
- Ways in which New Zealand has reduced bovine TB
- Map of TB testing intervals 2012
- Bovine Tuberculosis in Badgers. Report by the Ministry of Agriculture Fisheries and Food. November 1976.
- Bovine TB: Tb-free commercial dairy herds. ATIC0102. AHVLA, DEFRA. 24 June 2013.
- Ireland sees potential for big milk export push. dairyreporter.com. 21st July 2010.
- Is Europe Gearing Up for Greater Milk Production? thedairysite.com. 22 October 2012.
- Draft Strategy for Achieving "Officially Bovine Tuberculosis-Free" Status for England. www.defra.gov.uk. 4th July 2013.
- ALTERNATIVE METHODS OF CULLING. ccu.correspondence @defra.gsi.gov.uk. RFI 5525. 24 June 2013.
- Badgers/Bovine TB. ENVIRONMENT, FOOD AND RURAL AFFAIRS. Written Answers to Questions. 24 March 2004.
- Bovine TB - Key conclusions from the meeting of scientific experts1, held at Defra on 4th April 2011
- Controlling the Spread of Bovine Tuberculosis in Cattle in High Incidence Areas in England: Badger Culling. A consultation document issued by DEFRA. Consultation Issued: 15 December 2005.
- Convention on the Conservation of European Wildlife and Natural Habitats. Bern, 19.IX.1979.
- Proportion of TB infected herds in each county of Great Britain
- The occurrence of Mycobacterium bovis infection in cattle in and around an area subject to extensive badger control. R S CLIFTON-HADLEY et al. Epidemiology Department, Central Veterinary Laboratory, Surrey. Accepted 3 October 1994.
- Is specificity of the skin test as high as DEFRA claims?
- Eradicating TB requires 'every tool' - Glossop. www.fwi.co.uk. Philip Case. Tuesday 08 October 2013.
- estimates-of-badger-population-sizes-in-the-west-gloucestershire-and-west-somerset-pilot-areas.pdf
- The New Zealand way
- Gassing Trials. vwvw.gov.uk/defra. RFI 6597/6615. 18 June 2014.
- Badger Culling : Alternatives. Standard Note: SNSC6447. House of Commons Library. Science and Environment Section. Author: Dr Elena Ares. Last updated: 11 June 2014.
- Policy on issuing of licences to kill badgers. Badgers/Bovine TB. Environment Food and Rural Affairs. Written Answers on 18 Mar 2004.
- Crucial initial steps taken in New Zealand to control TB
- AHDB Levy Rates 01/04/14 to 31/03/15
- AHDB Corporate Plan 2014/17. Agriculture and Horticulture Development Board. April 2014.
- TBfree New Zealand Bovine TB Program Cost Breakdown for 2013/14
- Effort targeted at controlling bovine TB and how such work is accountable to farmers. DairyCo, AHDB. Email dated: 30th July 2014.
- BCG Vaccination Reduces Risk of Tuberculosis Infection in Vaccinated Badgers and Unvaccinated Badger Cubs. PLOS ONE. Stephen P. Carter et al. Published 12th Dec 2012.
- Bovine TB:Written statement - HCWS135 - UK Parliament. DEFRA. Made by Elizabeth Truss on 18 December 2014.
- Prospects for a TB board. Email from AHDB dated 15 September 2014.
- Bovine TB is tough bug to crack, says Government chief vet Nigel Gibbens
- Seasonal occurence of death due to TB in badgers
- TB progression from bite wounds and seasonal distribution of bite cases
- Cause of ill health and natural death in badgers in Gloucestershire. J Gallagher and J Nelson. Veterinary Record (1979) 105. 546-551.
- DEFRA may be failing in its duty of care to audit badger cull procedures
- Animal Health and Welfare Board for England. www.gov.uk. Downloaded 27 Feb 2015.
- There is no simple solution when it comes to TB. Alistair Driver, Farmers Guardian. 21 February 2015.
- Development of the New Zealand strategy for local eradication of tuberculosis from wildlife and livestock. PG Livingstone et al. N Z Vet J. 2015 Mar 25; 63(sup1): 98-107. Published online 2nd April 2015.
- Bovine TB Eradication Programme for England. DEFRA. July 2011.
- The Strategy for achieving Officially Bovine Tuberculosis Free status for England. April 2014. www.defra.gov.uk
- TB restricted herds as a % of SAM registered herds
- Statistics - national statistics. Incidence of tuberculosis (TB) in cattle in Great Britain. DEFRA.
- Animal Disease Statistics - Department of Agriculture and Rural Development, Northern Ireland
- Numbers of cattle slaughtered per month by county in Great Britain due to Foot and Mouth
- Impact of Foot and Mouth in Northern Ireland in 2001
- House of Commons Hansard Written Answers for 22 Mar 2010 (pt 0029)
External links
- Wildlifeonline - Badgers & Bovine Tuberculosis
- Video of a badger gaining access to a bin when searching for food
- Bovine TB in Alpacas and Llamas (Camelids)
- Bovine TB Blog
- Warmwell
- www.bovinetb.co.uk - Looking for the reform of a costly and misguided system
- Field Services South West Ltd
- NFU TB Free England
- Jan Rowe talks about bovine TB
Other relevant sources of information
- Badgers and cattle TB: Response to the Committee's 10th Report of Session 2007-08
- The impact of badger removal on the control of tuberculosis in cattle herds in Ireland
- The Gamma interferon test
- Woodland Trust: Position statement. Bovine Tuberculosis in cattle and badgers
- Pictures of a badger found dead in a field in an area badly affected by bovine TB.
- Bovine TB - A Way Forward (25 minute video)
- Public health and bovine tuberculosis:what's all the fuss about?
- House of Commons Environment, Food and Rural Affairs Committee Badgers and cattle TB: the final report of the Independent Scientific Group on Cattle TB Fourth Report of Session 2007-08 Volume I
- Bovine Tb Strategy - Review of Costs
- The European badger - Revised October 2011