
Summary
This page gives some insight into the potential for reducing bovine TB through culling badgers first when culling is carried out reactively and locally and then when carried out proactively in a thorough manner over a large area. Finally it looks at how long the impact of that thorough culling lasted.In this instance badgers were gassed using hydrogen cyanide between 1975 and 1981. Local reactive culling was carried out across South West England and wide area proactive culling was carried out in the district of Thornbury which is also located in South West England.
Gassing of badger setts
Public scepticism about the role of infected badgers in transmitting disease to cattle and criticism of the practice of gassing led to the Minister of Agriculture in 1979 asking Lord Zuckerman to review the problem and make recommendations. Gassing operations ceased at the start of the Zuckerman review until October 19801,8.Zuckerman concluded that the high density and close proximity of the cattle and badger populations in parts of South-West England favoured the transmission of the disease both from badgers to cattle and from one infected group of badgers to another and that the disease seemed to have spread since control measures had been halted in October 1979. In the Iight of these findings he recommended that gassing operations be resumed as soon as possible and that these should be monitored to assess their impact on prevalence of the disease in cattle and badgers1,8.
In accordance with another recommendation by Lord Zuckerman the concentrations of hydrogen cyanide gas needed in the air of a sett to kill badgers quickly and humanely were investigated . This investigation cast doubt on the humaneness of this method of killing because research showed that badgers did not die immediately underground. Gassing was therefore replaced in July 1982 with live trapping followed by humane killing (usually shooting)1,8.
The main technical issue with gassing is the difficulty of gases spreading through complex tunnel systems containing blind-ends. No information on the proportion of animals likely to suffer exposure to sub-lethal concentrations is available, but this risk is considered to be significant and needs to be assessed in combination with the consequences of sub-lethal exposure to toxins2.
In view of this, it was discovered that there are no research organisations in the UK who are willing to support or carry out field trials using carbon monoxide, which in terms of effectiveness and humaneness is considered to be the most viable gas to use2, without first undertaking lengthy, extensive and costly experimental studies under rigorously controlled conditions. All research organisations capable of carrying out field evaluation in badgers who were contacted declined to offer advice or discuss the potential opportunity for such evaluation3.
How MAFF carried out gassing between 1975 and 1982
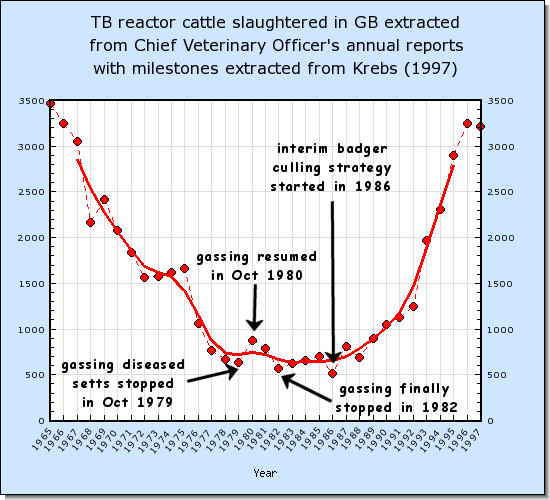
Ministry for Agriculture and Food became responsible for badger culling operations in 1975, which it implemented by gassing badgers in their setts using cyanide gas. Under this policy gassing operations were conducted in a total of 166 areas, averaging 7km2, throughout the South West of England.5Herd incidence is shown in the following graph which was taken from numbers presented in the table of Appendix 2 on Page 141 of Reference 1.
Once a breakdown had been attributed to badgers, populations were sampled, normally up to one kilometre from the farm boundary, to identify infection status. Setts of infected social groups identified and other in-contact social groups were then gassed. However, the methodology for identifying social groups was not sufficiently rigorous to ensure that these were always precisely identified. Gassed setts were revisited for up to two years after initial gassing to prevent immigrant badgers from contracting infection from contaminated setts or bringing in new infection.
Initially, gassing operations were subject to agreement by the occupiers of the land. New legislation was subsequently introduced (Agriculture (Miscellaneous Provisions) Act 1976; and the Badgers (Control Areas) Order 1977)providing powers of entry in four defined areas for badger investigation, surveillance and control operations. Outside these statutory areas, badger control operations were subject to the voluntary agreement of the occupier.1
The influence of MAFF gassing operations in the South West
In the top graph, whenever gassing was applied, the number of reactor cattle dropped, and whenever gassing was stopped, the number of reactor cattle increased. Also in the above graph shown in Fig 72, herd incidence dropped more rapidly when the ministry started its gassing operations in 1975. Both these graphs suggest that the gassing operations as applied by the ministry had a major impact on reducing bovine TB. Did they? This section takes a closer look.Reference 6 points out that in 1975/76, in addition to the ministry starting its gassing operations, which were confined to the South West, two other events occurred in England and Wales.
Firstly, under a European Commission Directive, the human tuberculin used in the skin test on cattle was changed for a bovine tuberculin on 1st March 1975. This was partly because of improved specificity for discriminating against skin tuberculosis. It was argued that use of this tuberculin would reduce the number of false positive reactors detected. The new tuberculin was more sensitive for detecting M bovis and caused the number of reactors to climb. The initial increase in the number of herd breakdowns in 1975 can be seen in Fig 91 below. Twelve months after the tuberculin was changed, the test protocol was changed to compensate. This change in protocol probably over-compensated and caused the number of detected reactors to drop.11
Secondly, in 1976, additional control measures were imposed to reduce the risk of importing infected cattle into Great Britain from Ireland. The yearly incidence of herd infection from Irish bred cattle was reduced but little effect would have been seen in South-West England since the majority of imported Irish cattle went to North-East England and Scotland. Such cattle only accounted for 0.33% of infected herds in Gloucestershire, Avon and Cornwall, before the introduction of these control measures.6
Let us now take a closer look at how the drop in herd incidence in the South West compares with that in the rest of England and Wales. This can be done by taking the incidence in one year as reference. Let us do this by settting the incidence in 1974 in both regions to 100%. The graph below shows relative to 1974 the extent to which herd incidence dropped in both regions in subsequent years.
Evidently herd incidence relative to the level in 1974 dropped no more rapidly in the South West, where MAFF gassing opertions were confined, than in the rest of England and Wales. Gassing of badgers obviously would not have had any impact on the drop in disclosed levels in the rest of England and Wales because in the rest of England and Wales no gassing took place. This suggests that factors which caused the drop in levels in the rest of England and Wales, such as the change in the tuberculin, for example, may have contributed to the apparent drop seen in the South West.
So this begs the question, what impact may the gassing of badgers have?
The influence of gassing operations at Thornbury
Reference 6 casts some light on the impact of gassing badger setts by looking at the incidence of herd infection in a 104 km2 area in the parish of Thornbury which formed part of the counties of Avon and Gloucestershire. In this area a thorough culling exercise was undertaken with the aim to remove all badgers. Operations took place between 1975 and 1981. Thornbury was selected as the area in which to take extensive action because- incidents of herd infection with M. bovis continued at an unexpectedly high frequency, even after Great Britain became an attested area in 1960,
- M. bovis infection had been identified in the local badger population, and,
- unlike most areas subject to statutory badger removal operations, the area had clearly defined geographical boundaries which would hinder recolonization by badgers
Thornbury was too small an area to support a large enough number of herds (circa 130 in 19926) to reveal with confidence the impact of the more extensive gassing operations year by year. However when results are collected over the course of 5 years the averaged numbers are more meaningful. The graph in Fig 92 compares the proportion of herds which are infected in the Thornbury area with that in all of the South West in each 5-year period from 1966 to 1990 when the proportions in the period 1971 to 1975 are used as reference.
Data shown in the above graph were taken from Tables 2 and 3 in Reference 6. It should be noted from the large confidence intervals up to the 1976 to 1980 period that there is some uncertainty regarding the true herd incidence in the Thornbury area. In fact if this data were to be re-acquired many times, on 95% of these occasions the Thornbury levels in the 1971 to 1975 period would be expected to lie within about plus or minus 24% of the levels shown in Fig 92.
Badgers in Thornbury were killed between 1975 and 1981 and it can be seen in Fig 92 that in the 10 years from 1981 to 1990, incidences in Thornbury appear to be about a quarter of these in the whole of the South West when levels in both areas are expressed as a proportion of what they were in 1971 to 1975. These are total incidences which include unconfirmed incidences which account for about half of the cases. If only confirmed incidences are looked at, Reference 6 reports that no confirmed incidences were found for 10 years after the last badger was killed.
Fig 98 below shows that it has taken about 35 years for infected herd numbers to get back to what they were before the cull started. During this time infected herd numbers in the whole of the South West have more than quadrupled.
Data shown in the above graph were taken from Tables 2 and 3 in Reference 6 and the additional data supplied by DEFRA in Reference 10.
The large reduction in cattle incidence in Thornbury compared to all of the South West suggests that the reason why M. bovis continued at an unexpectedly high frequency in Thornbury after Great Britain became an attested area in 1960 was because of cross-infection from badgers. These results support the following statement made in the European Commission guidance report7 which was published in 2006.
The elimination or reduction of the risk posed by an infected wildlife reservoir enables the other measures contained in the programme to yield the expected results, whereas the persistence of TB in these wildlife populations impedes the effective elimination of the disease.
Is gassing effective and what efforts are being made to test and develop different gassing approaches?
Reference 9 reports that during the Thornbury cull, one sett had to be revisited 19 times! (Badgers in the Thornbury district were gassed using a commercial product called Cymag.12 According to Reference 20, Cymag is a powder which produces hydrogen cyanide gas when placed on moist earth. Storage and use of Cymag was withdrawn by the European Community (EC) review programme on 31st December 2004.13) As referred to above, the main technical issue with gassing is the difficulty of gases spreading through complex tunnel systems containing blind-ends. According to Reference 18, DEFRA do not appear to have (current 24th June 2013) any research and development projects investigating alternative culling methods, and as such no trials of alternative culling methods are being run. However according to Reference 16 which was published on 23rd May 2013 (paradoxically earlier than the FoI request response in Reference 18), DEFRA are currently looking into other forms of gassing. [Start of editor note added on 6th July 2013] Perhaps DEFRA are NOT currently looking into different gassing methods but are currently considering whether to start such an investigation.[End of editor note] In fact the DEFRA draft strategy published on 4th July 2013 in Reference 19 states the followingFurther research into alternative population control methods (e.g. sett-based culling methods and non-lethal methods) is also under consideration. This includes a potential investigation into the use of anoxic gas or gas-filled foam as a sett-based means of humane culling.
According to Wikipedia, "anoxic" means the total depletion in the level of oxygen.
Badger protection legislation
In the UK under Section 3 PBA 1992, it is an offence to wilfully kill, injure or take a badger, or to attempt to do so.14 It is also an offence to either intentionally or recklessly interfere with a badger's sett.14 On 18th March 2004 Ken Bradshaw, the then Parliamentary Under-Secretary for DEFRA replied in a response to a Parliamentary Question that it was current policy not to issue any licences under sub-section 10(2)(a) to prevent the spread of bovine tuberculosis, except for animals held in captivity.17However European law applies no such restrictions so the UK is at liberty to amend these laws as it sees fit. Indeed in 1997 it was reported that in Europe, the following countries permitted hunting during an open season: France, Switzerland, Austria, Germany, Denmark, Norway, Lithuania, the Czech Republic, Slovenia, the Slovak Republic, Romania and Bulgaria. In addition to this Hungary and Luxembourg were said to be reconsidering their protected status for the badger.15 In recent years, Germany have shot about 66,000 badgers each year29. In 2013 and 2014, England shot 1,000 and 300 respectively. For the 2013 figure, please see Section 4.3.1 on Page 11 of Reference 30 and for the 2014 figure, please see Page 1 of Reference 31.
Regarding the extent to which wildlife may be controlled under European Union law, the Bern Convention allows for the regulated management of badgers for the purpose of preventing serious damage to livestock provided this is not detrimental to the survival of the population concerned21,22. According to Ref 23, the Bern Convention was adopted in Bern, Switzerland in 1979, and the UK government ratified the convention in 1982.
Survival of the badger population
Badgers may be managed provided this is not detrimental to the survival of the population concerned.21,22 The following is advice offered by the Science Advisory Council concerning proposals in 2010 by the Conservative government to cull. The advice refers to recovery in the Thornbury district. The Science Advisory Council (SAC) provides Defra with independent advice on science policy and strategy. The council advises the Chief Scientific Advisor and through him to ministers.27On the issue of local extinction, repopulation following complete clearance of badgers from a single area (Thornbury) took a long time (~10 years). However, this recovery was characterised by a rapid initial partial re-population through immigration, followed by a slower increase through breeding.25
The cost of gassing
Although materials available today are easier to handle and hopefully more efficient, gassing as deployed in the Thornbury district to achieve a thorough cull did have significant financial cost. In fact the total cost of the national badger control strategy from 1975/76 to 1983/84 came to £11.3 million pounds in 1983/84 prices. However, this presumably included some cage trapping (because gassing stopped in 1982) and included gassing operations in the 166 areas of South West England (as referred to above). Of these costs, one half were accounted for by staff and support expenditures for field operations and supervision. Two thirds of this cost were attributable to the South West region. The other major cost element was research and development which came to £3.6 million24.In a DEFRA funded research programme in 2006 (SE3117) the total cost of gassing was reported to be about half of that of trapping per square kilometre. (See Table 1 on Page 58 of Ref 26)
Annex B of the government's approach to tackling the disease and consultation on a badger control policy published in September 2010 states the following.
The cost of conducting five annual culls over a 150 km2 area, 75% of which was accessible for culling, is estimated as £2.14 million for cage-trapping (as undertaken in the RBCT) at £3,800/km2/year, or £1.35 million for snaring or gassing at roughly £2,400/km2/year. The predicted annual cost of a farmer-led culling operation is estimated to be around £562,500 at £1,000/km2/year.28
One square kilometre equals 247 acres.
Is Thornbury of any relevance today?
Although the Thornbury cull was conducted more than 30 years ago, the following issues should be considered when assessing the value of what happened during and after the Thornbury cull. These conclusions take account of recent data in Fig 98 which shows how herd incidence in the South West of England between 1981 and 2010 has increased substantially more than that in the Thornbury district.- TB in the Thornbury district was persistent. In fact the area had a long history of TB. At the time, levels were very high compared with levels in the rest of the country and cattle measures were failing to control these levels.8
- The proportion of cattle herds infected in the Thornbury district prior to the cull was about 8.6% (see Table 3 in Reference 6 for years 1971 to 1975). The proportion across the South West in 2012 averaged about 25% so is a lot higher. (See this graph). Since the level of infection in badgers and cattle tend to influence each other, it is likely that badgers are infected to a level in South West England which is substantially higher than what they were at Thornbury during the cull. As such, any control measures today will probably need to address a much higher level of disease.
- Culling in the Thornbury district more than halfed the incidence of TB in cattle herds (see Fig 92).
- The number of infected herds in the Thornbury district did not return to numbers prior to the cull far at least 25 years whereas the number of infected herds in the South West more than doubled during this time (see Fig 98).
Conclusions drawn from Thornbury
In essence, in a hot spot area where a high level of disease exists in badgers and cattle control measures are not working, it is likely that TB levels of cattle in that area will be substantially reduced if all badgers in that area are cleared and then left to recolonize. This conclusion is based on the results of the exercise at Thornbury and in this exercise, recolonisation of badger setts was prevented for just less than 4 years after 2 years of extensive and intensive gassing. It is likely that badger removal in this area was thorough.If disease dynamics in the Thornbury district were representative of the dynamics which exist in persistent areas today, the results of the Thornbury trial suggest that if thorough culling of badgers were to be implemented today, this should bring a long lasting return. This assumes that (a) current cattle measures are sufficiently robust to keep cattle to cattle transmission sufficiently low (b) standards to which veterinaries perform the test are adequately high and (c) problems caused by spread to other species such as deer are much smaller than problems caused by badgers. Certainly if such a culling strategy had been implemented 25 years ago in the worst affected areas, it is likely that (based on TB levels in the Thornbury district in the last 35 years) TB levels in England and Wales would be substantially less today.
Future prospects
In 2010, areas of persistent TB covered most of the South West, Wales and West Midlands, and in the 5 years leading up to 2010, have covered a steadily increasing proportion (as shown in these interactive maps) of the East Midlands and the North West, East and South East regions of England. Unless bold steps are taken now to reduce the badger element, the reinforcement and establishment of this spread through cross-species transfer is likely to continue.References
- Krebs, J.R., Anderson, R.M., Clutton-Brock, T., Morrison, W.I., Young, D. and Donnelly,C.A., Bovine tuberculosis in cattle and badgers, MAFF Publications, PB3423, London.(1997)
- Review of effectiveness, environmental impact, humaneness and feasibility of lethal methods for badger control
- Fumigation as a badger culling technique
- TB reactors in Great Britain from 1956 to 1997. DEFRA response to a request for information. 7th Oct 2011
- Final Report of the Independent Scientific Group on Cattle TB
- The occurrence of Mycobacterium bovis infection in cattle in and around an area subject to extensive badger control. R S CLIFTON-HADLEY et al. Epidemiology Department, Central Veterinary Laboratory, Surrey. Accepted 3 October 1994.
- Eradication of Bovine Tuberculosis in the EU
- Badgers, Cattle and Tuberculosis. Zuckerman O.M. MINISTRY OF AGRICULTURE, FISIIERIES AND FOOD. August 1980.
- Bovine Tuberculosis in Badgers. Report by the Ministry of Agriculture Fisheries and Food. November 1976.
- Number of herd incidences of TB in the South West and Thornbury. FoI to DEFRA. RFI 5287. 5th April 2013.
- Animal health: the report of the Chief Veterinary Officer. 1971 to 1977. (Bovine TB sections only)
- Bovine TB: badger culling. Sixth Report of Session 2005-06. EFRA. Published on 15 March 2006.
- Expiry of approval for storage and use of Cymag. Health and Safety Executive. http://www.hse.gov.uk. 4 January 2005.
- Wildlife Offences: Legal Guidance: The Crown Prosecution Service. http://www.cps.gov.uk. Downloaded on 20th June 2013.
- The conservation and management of the European badger (Meles meles). Nature and environment, No. 90. Council of Europe. Authored by H.I Griffiths and D.H Thomas. 1997.
- DEFRA looks again at gassing setts to fight TB. Farmers Weekly. Published on 23rd May 2013.
- Policy on issuing of licences to kill badgers. Badgers/Bovine TB. Environment Food and Rural Affairs. Written Answers on 18 Mar 2004.
- ALTERNATIVE METHODS OF CULLING. ccu.correspondence @defra.gsi.gov.uk. RFI 5525. 24 June 2013.
- Draft Strategy for Achieving "Officially Bovine Tuberculosis-Free" Status for England. www.defra.gov.uk. 4th July 2013.
- PESTICIDE and COSHH - Rabbit and mole products. http://www.dshearer.co.uk. Jan 2010.
- Controlling the Spread of Bovine Tuberculosis in Cattle in High Incidence Areas in England: Badger Culling. A consultation document issued by DEFRA. Consultation Issued: 15 December 2005.
- Convention on the Conservation of European Wildlife and Natural Habitats. Bern, 19.IX.1979.
- Ratification of the Convention on the Conservation of European Wildlife and Natural Habitats in th UK. Joint Nature Conservation Committee. June 2013.
- BADGERS AND BOVINE TUBERCULOSIS - REVIEW OF POLICY. MINISTRY OF AGRICULTURE, FISHERIES AND FOOD. G M Dunnet, D M Jones, J P Mclnerney. March 1986.
- Science Advisory Council/Bovine Tuberculosis Science Advisory Body Joint Group on Defra's Bovine TB consultation
- Review of the bovine tuberculosis (bTB) research programme. DEFRA, Veterinary Exotic Diseases, Research and Official Controls Division. 3rd-6th July 2006.
- Science Advisory Council
- DEFRA consultation Sept 2010: Annex B - Scientific evidence on culling
- Jahresstrecke Dachse. (Annual number of badgers shot in Germany from 2002 to 2013) www.jagdverband.de
- Pilot Badger Culls in Somerset and Gloucestershire. Report by the Independent Expert Panel. Chair: Professor Ranald Munro. Presented to DEFRA Secretary of State Owen Paterson MP, March 2014.
- Summary of badger control monitoring during 2014. DEFRA. December 2014.