
Bovine TB in Ireland and how it compares to that in the UK
The Irish Republic is the closest equivalent to Great Britain and Northern ireland in that all 3 countries have a dense population of badgers (see the table below for estimated densities) and all 3 countries have a bovine TB problem.This page illustrates the extent of bovine TB in the Irish Rebublic, illustrates how the situation changed between 1996 and 2006, compares this with the change in Great Britain and Northern Ireland, and gives a measure of what the Irish Republic have been doing to address the problem.
Cattle-related actions are similar in both the Irish Republic and Northern Ireland, focusing on surveillance (the detection of new cases, through field and factory surveillance) and control (the resolution of existing cases, through herd restriction, reactor removal, ongoing testing, etc.). However badgers are routinely culled in the Irish Republic but not in Northern Ireland. This has been the status up to November 2017 at least.
Badger densities
Estimated badger populations in Great Britain, the Irish Republic and Northern Ireland are shown in the table below.| Country | Badger population | Year when estimated | Area (km2) | Number of badgers per km2 |
|---|---|---|---|---|
| Great Britain | 300,000-350,0003 | 2003 | 229,84843 | 1.4 |
| Republic of Ireland | 72,000-95,0004 | 2009 | 70,27349 | 1.2 |
| Northern Ireland | 33,5005 | 2007/08 | 13,84345 | 2.4 |
Interestingly the average densitiy of badgers in Northern Ireland is estimated to be much higher than that of badgers in Great Britain. Densities in Great Britain and the Irish Republic are closer matched. However these estimates were made in 2003 and 2009 respectively. Also in Great Britain, densities in Scotland are considered to be much lower than in South West England46.
Regarding badger densities in South West England, a study commissioned by DEFRA and carried out in 2005/2006 to provide baseline data on regional badger densities foraging on open pasture in each of Cornwall, Devon, Herefordshire and Gloucestershire found that average badger density was between 3.9 and 4.5 badgers per sq km depending on county. (See Table 9 on Page 13 of Ref 48)
It should be noted that estimating badger densities is very difficult and prone to error. In fact in Ref 47, badgers numbers in the Irish Republic in 1995 were estimated to be more than twice those reported in Reference 4 in 2009. Ref 41, which was published in 2013, puts forth reasons why the estimates given in Ref 47 may be over-estimates. A cursory look at the numbers of badgers officially culled between 1995 and 2009 (see Fig 11 below) falls far short of explaining this discrepancy.
The prevalence of bovine TB in cattle
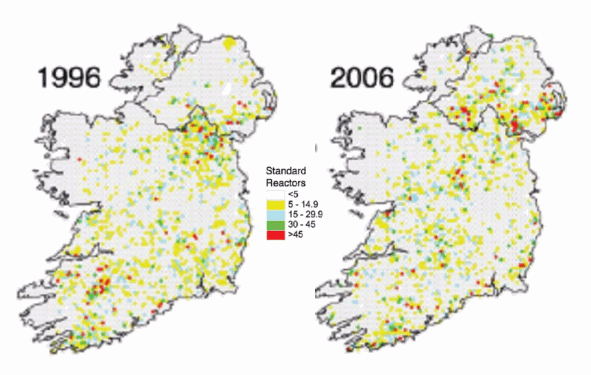
The above images were taken from Reference 1, where maps are presented every 2 years, which can either show a reduction or increase every 2 years. These images suggest that the problem in Northern Ireland between 1996 and 2006 became more established whereas the problem in the Irish Republic reduced slightly.
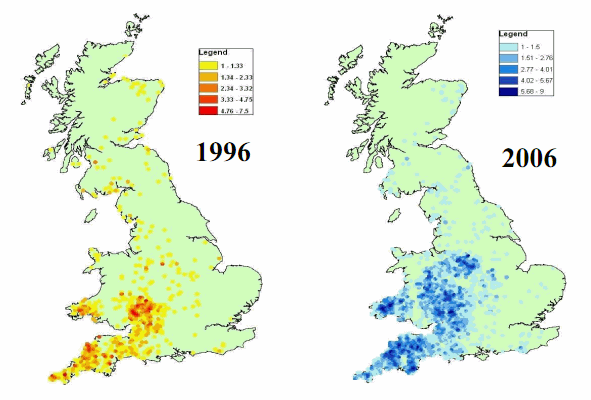
The above maps have been taken from Reference 2. The problem has clearly deteriorated in South West England, Wales and the West Midlands, is becoming more established in Central and Northern England, and is spreading into new areas of Eastern England. New incidences in Eastern England which are remote from established areas are much more likely to be due to cattle-to-cattle transmission than badger-to-cattle transmission18.
In the above graph, the proportion of cattle culled was obtained by dividing the number of cattle culled by the total number of cattle which existed in each year as supplied in Reference 20 except for data labelled "Northern Ireland 2" where incidence numbers are used. Such incidences were calculated by dividing the number of reactors disclosed by the number of animals tested each year. Data was sourced as shown in the table below.
| Northern Ireland | References 20, 25 and 29 |
| Northern Ireland 2 | Request, reply and received data |
| Irish Republic | Reference 32 |
| Great Britain | Request and Reply (References 20, 22 and 24) |
It should be noted that there are likely to be anomolies between what data presented in these graphs represent. For instance some data include cases discovered in slaughterhouse inspections and other data do not. However, in Great Britain, Total slaughterhouse cases in 2009 and 2010 accounted for about 3% of the total number of animals reported to be infected by TB in each year so although this contribution is significant it is not large.
Data for the year 2001 is not shown in the graphs for Great Britain and Northern Ireland because sufficient testing was suspended during this year due to Foot and Mouth as to cause significant under reporting of cases.
Northern Ireland operates an annual testing policy throughout the country so in theory the number of animals tested should equal the number of existing animals in the country. The differences between the two sets of numbers for Northern Ireland are more clearly shown in Graph 17 below which shows data from the same sources as in the graph above but from 1998 only. Such data was re-downloaded from the above sites in Mar 2013 when data for 2012 were included for all countries. Regarding the above graph, cattle slaughtered pre 1990 in Northern Ireland do not include abattoir cases.
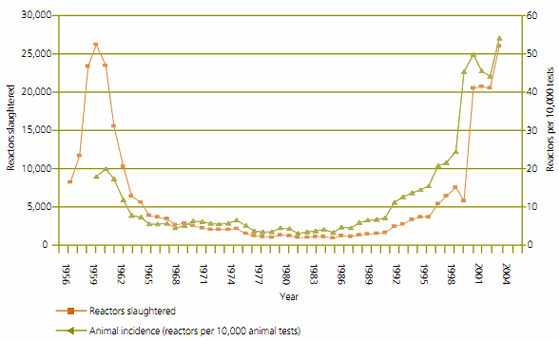
In the Irish Republic, approximate values for the number of TB reactors between 1961 and 1964 were read off a graph shown in Fig 1 of Reference 19. Unlike all other years for which the number of existing cattle was taken from reported numbers for each year, the number of existing cattle between 1961 and 1964 was assumed to be constant and equal to 5,000,000. This number lies roughly half way between the reported numbers for 1960 and 1965.
As shown in the Fig 426 below, cattle numbers have remained almost constant in Northern Ireland in each year between 2000 and 2016 whereas numbers in other countries have dropped significantly. Northern Ireland's trade has a record of relying more on exports than other countries in the British Isles so has operated in different markets.
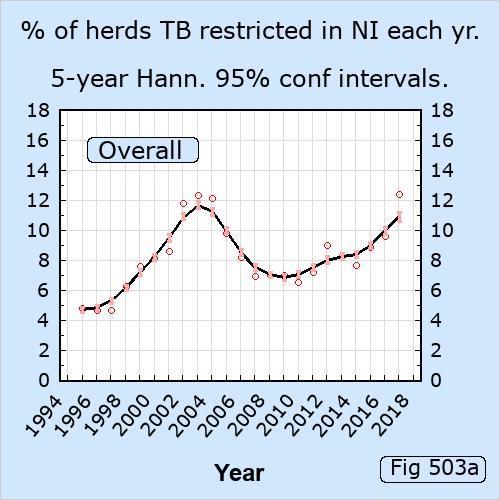
As shown in Fig 460 and 463 below, in recent years TB levels in the Irish Republic have dropped whilst TB levels in Northern Ireland have risen. This may be largely due to the fact that the republic cull badgers and the north does not. In November 2017, Northern Ireland announced proposals to introduce a programme of badger removal in targeted areas.50
For references which give the sources of data for the above graphs, please click here.
The graph below shows the number of TB restricted herds instead of cattle reactors and shows data for England instead of Great Britain. Evidently between 1998 and 2012 the number of TB restricted herds in England has quadrupled whilst the number of such herds in the Irish Republic has halved.
In the above graph, data for England was sourced from a response to a Freedom of Information request sent to DEFRA (RFI 2454) and data extracted from the Detailed TB Statistics downloaded from the DEFRA web site.
Data for the Republic of Ireland was sourced from data received in reply to a request sent to foi@agriculture.gov.ie and data downloaded from the DAFF web site.
Data in Figs 135 and 136 were sourced as follows. Cattle numbers were extracted from DEFRA's Cattle and Calves dataset. Reactors in England, Wales and Scotland were extracted from VETNET's COUNTY ANIMAL STATISTICS dataset and SAM's 2014.03.12 monthly download. Southern Ireland's data was extracted from Refs 32 and 28. Northern Ireland's data was extracted from Refs 25 and 29.
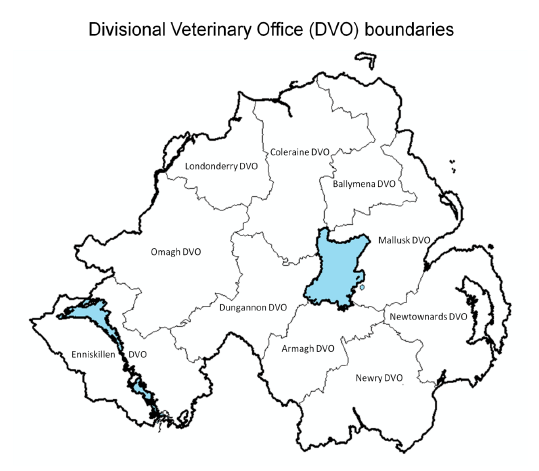
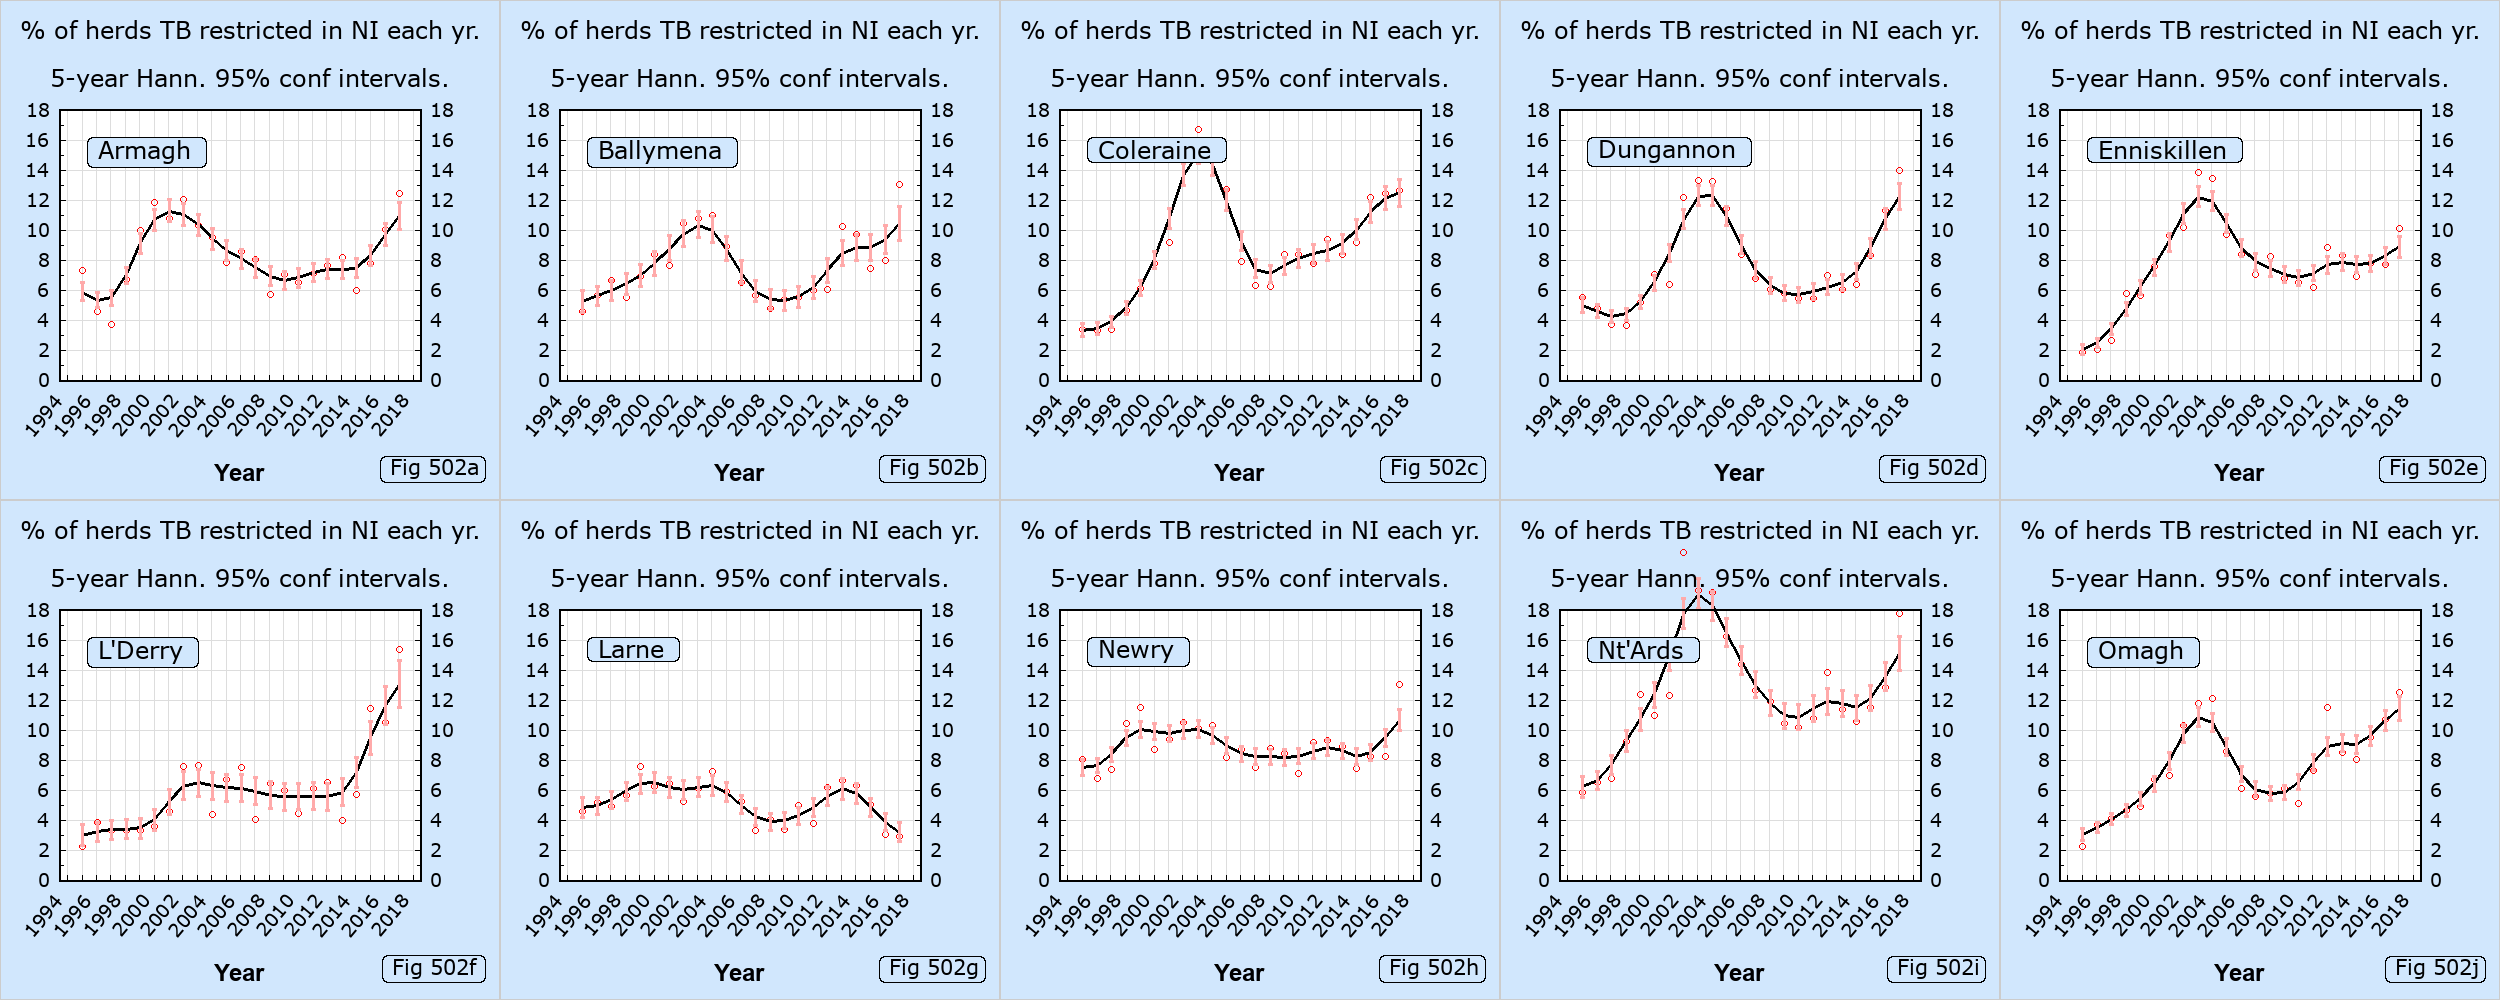
Restricted herds in each Divisional Veterinary Office (DVO)
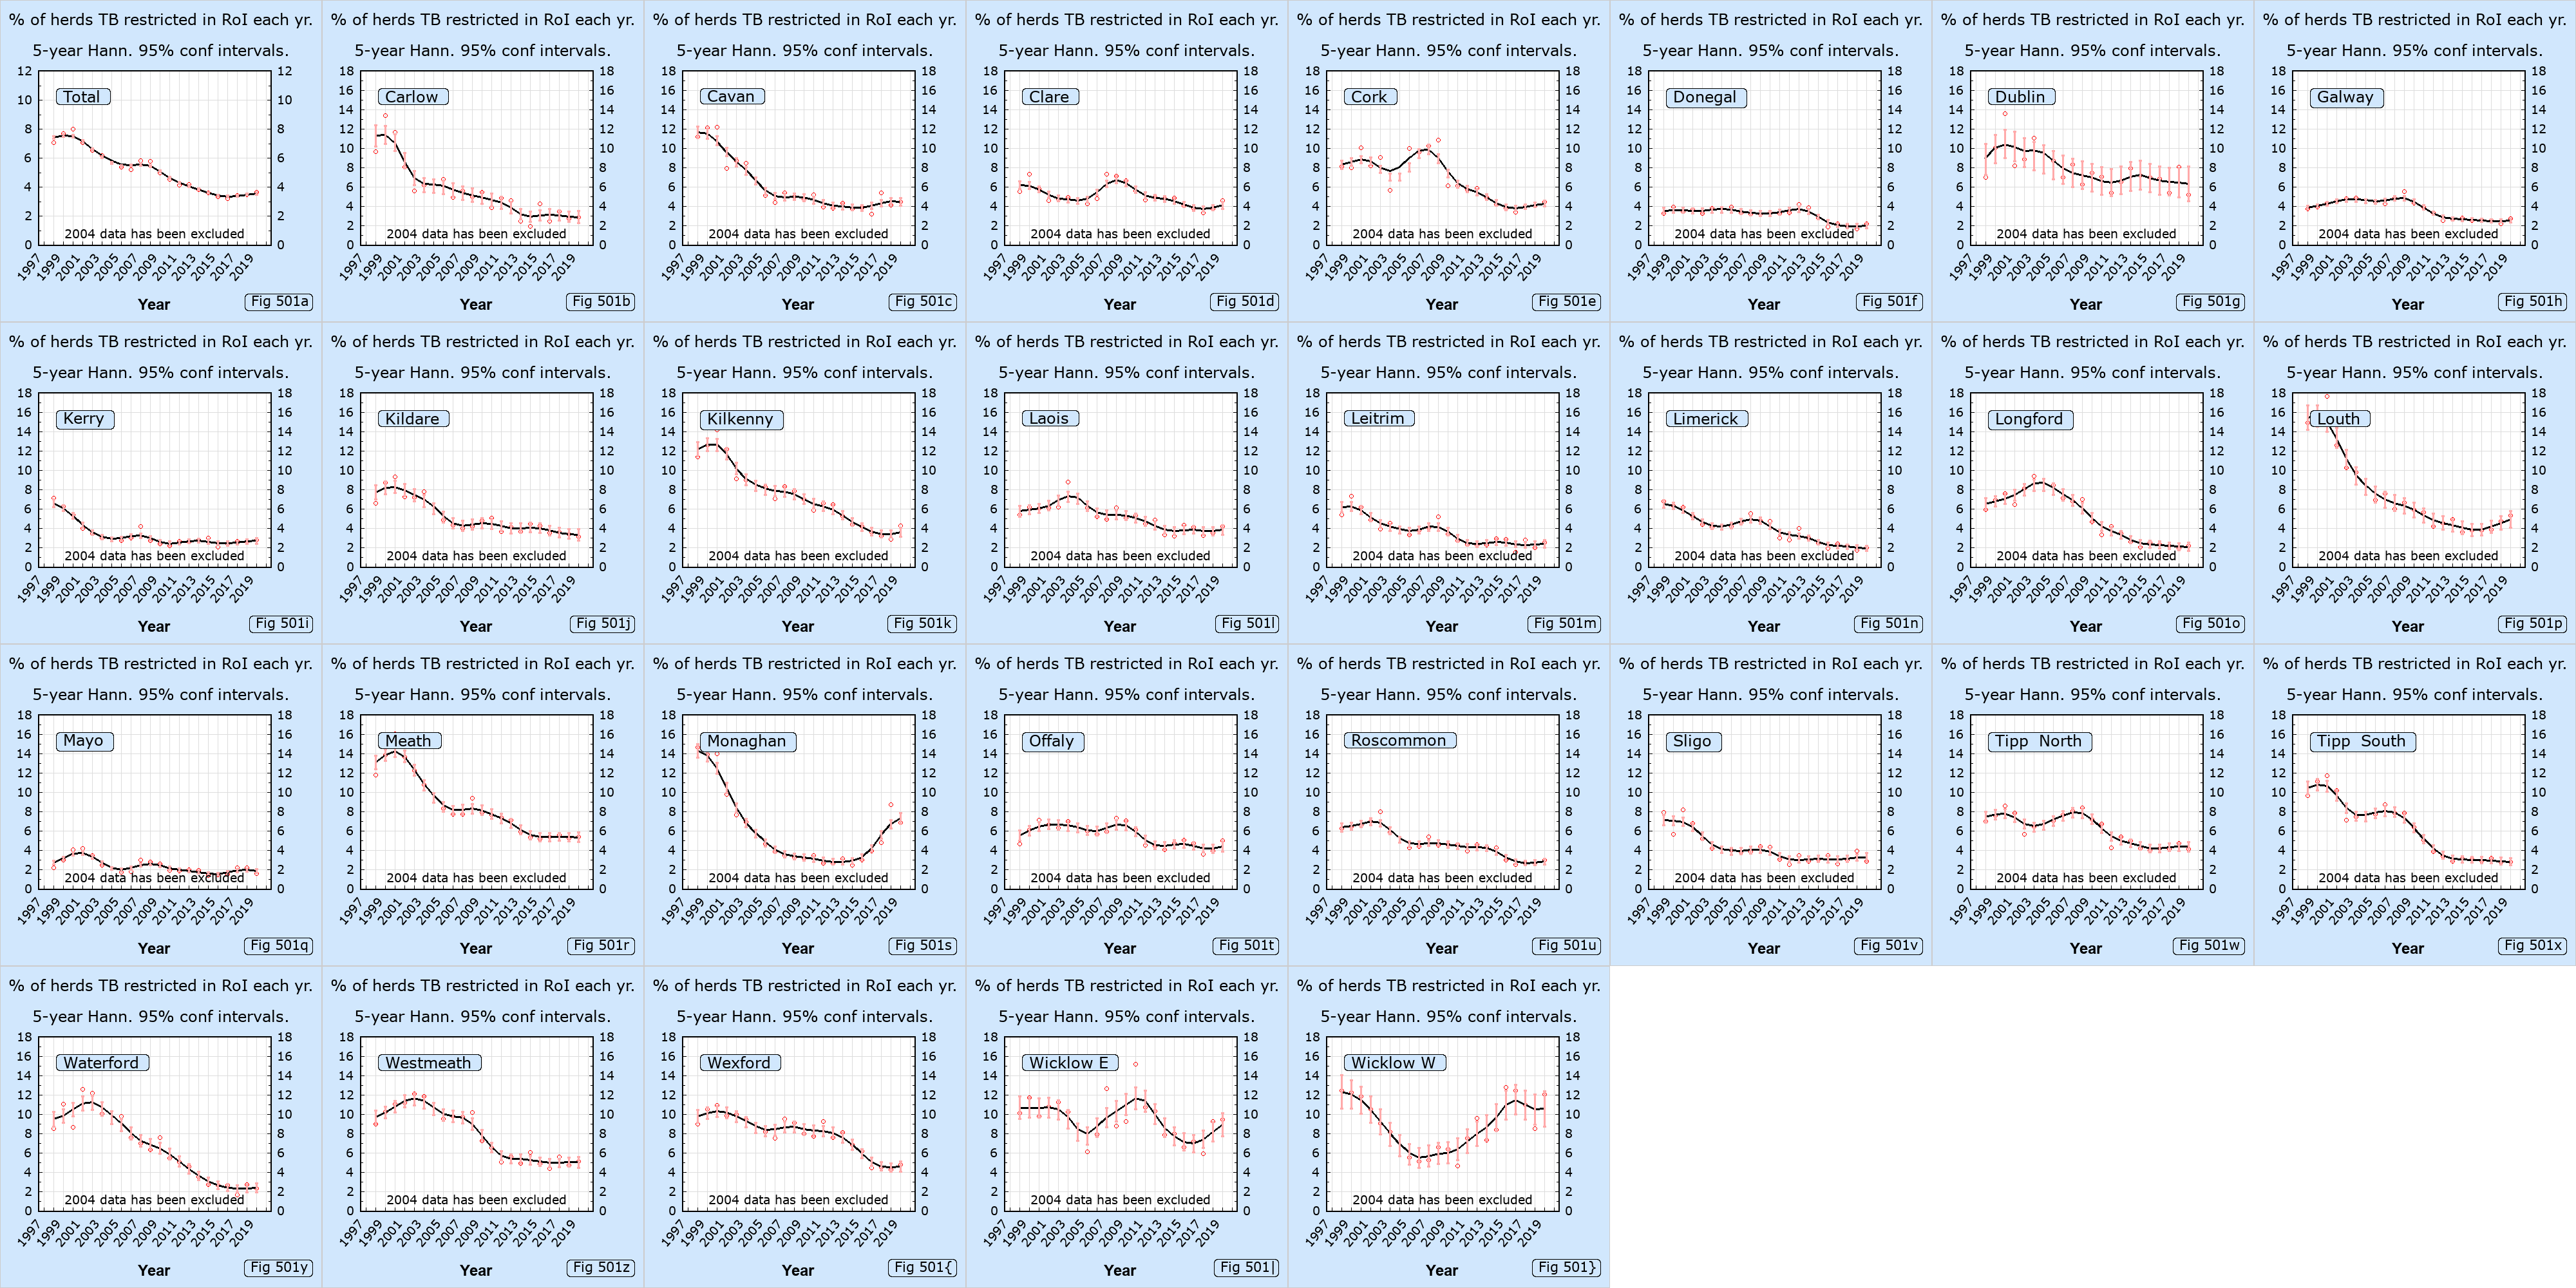
Restricted herds in country
Restricted herds by DVO
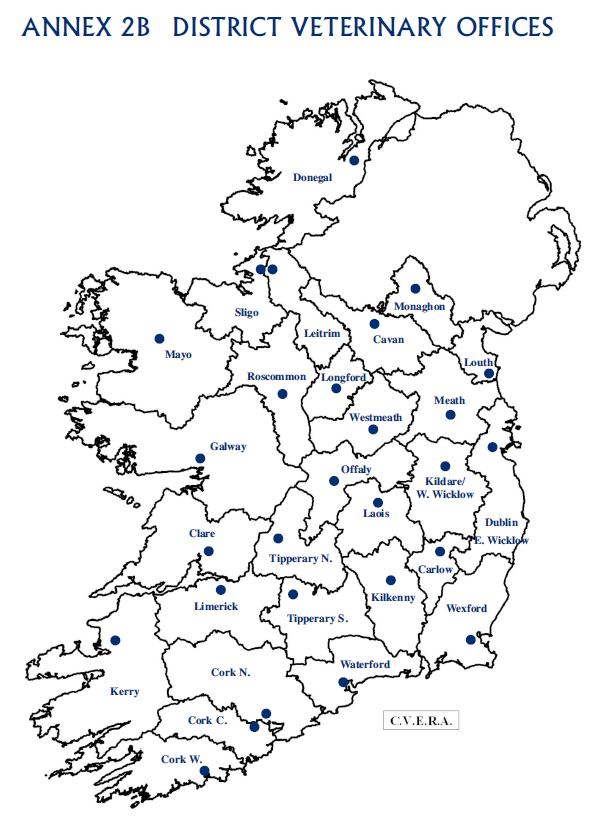
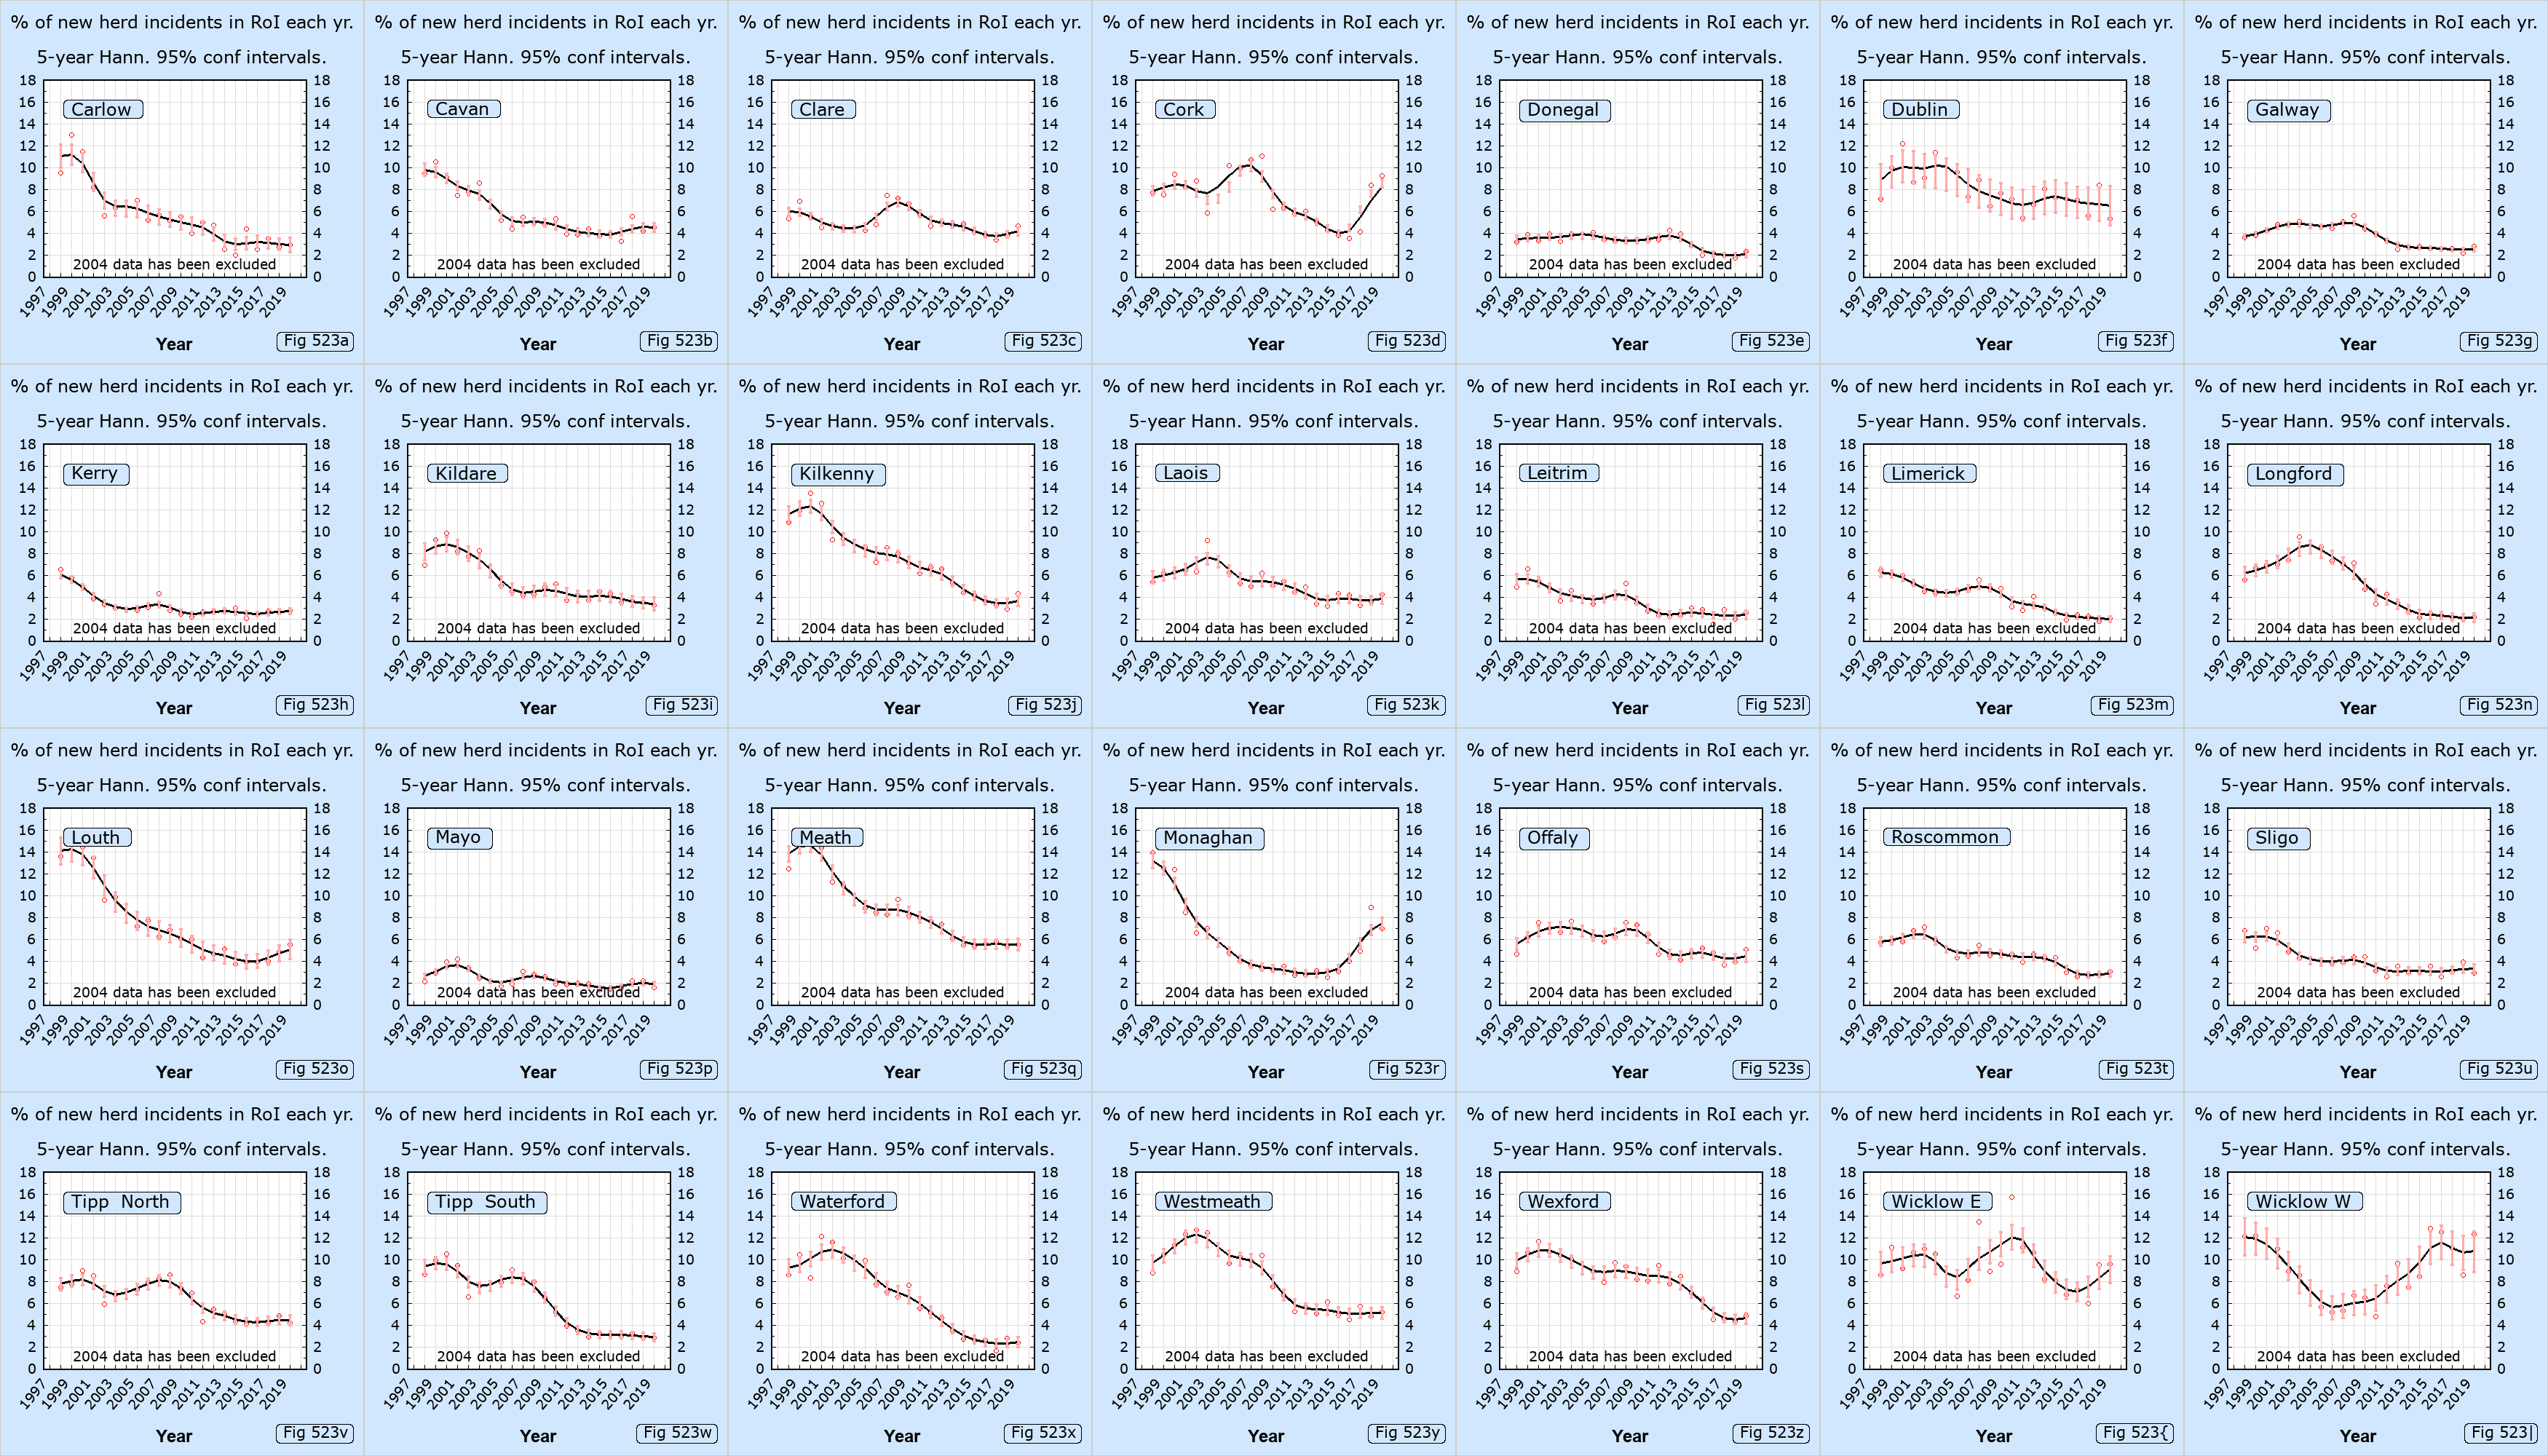
Herd incidence by DVO
Restricted herds by DVO
Animal reactors by DVO
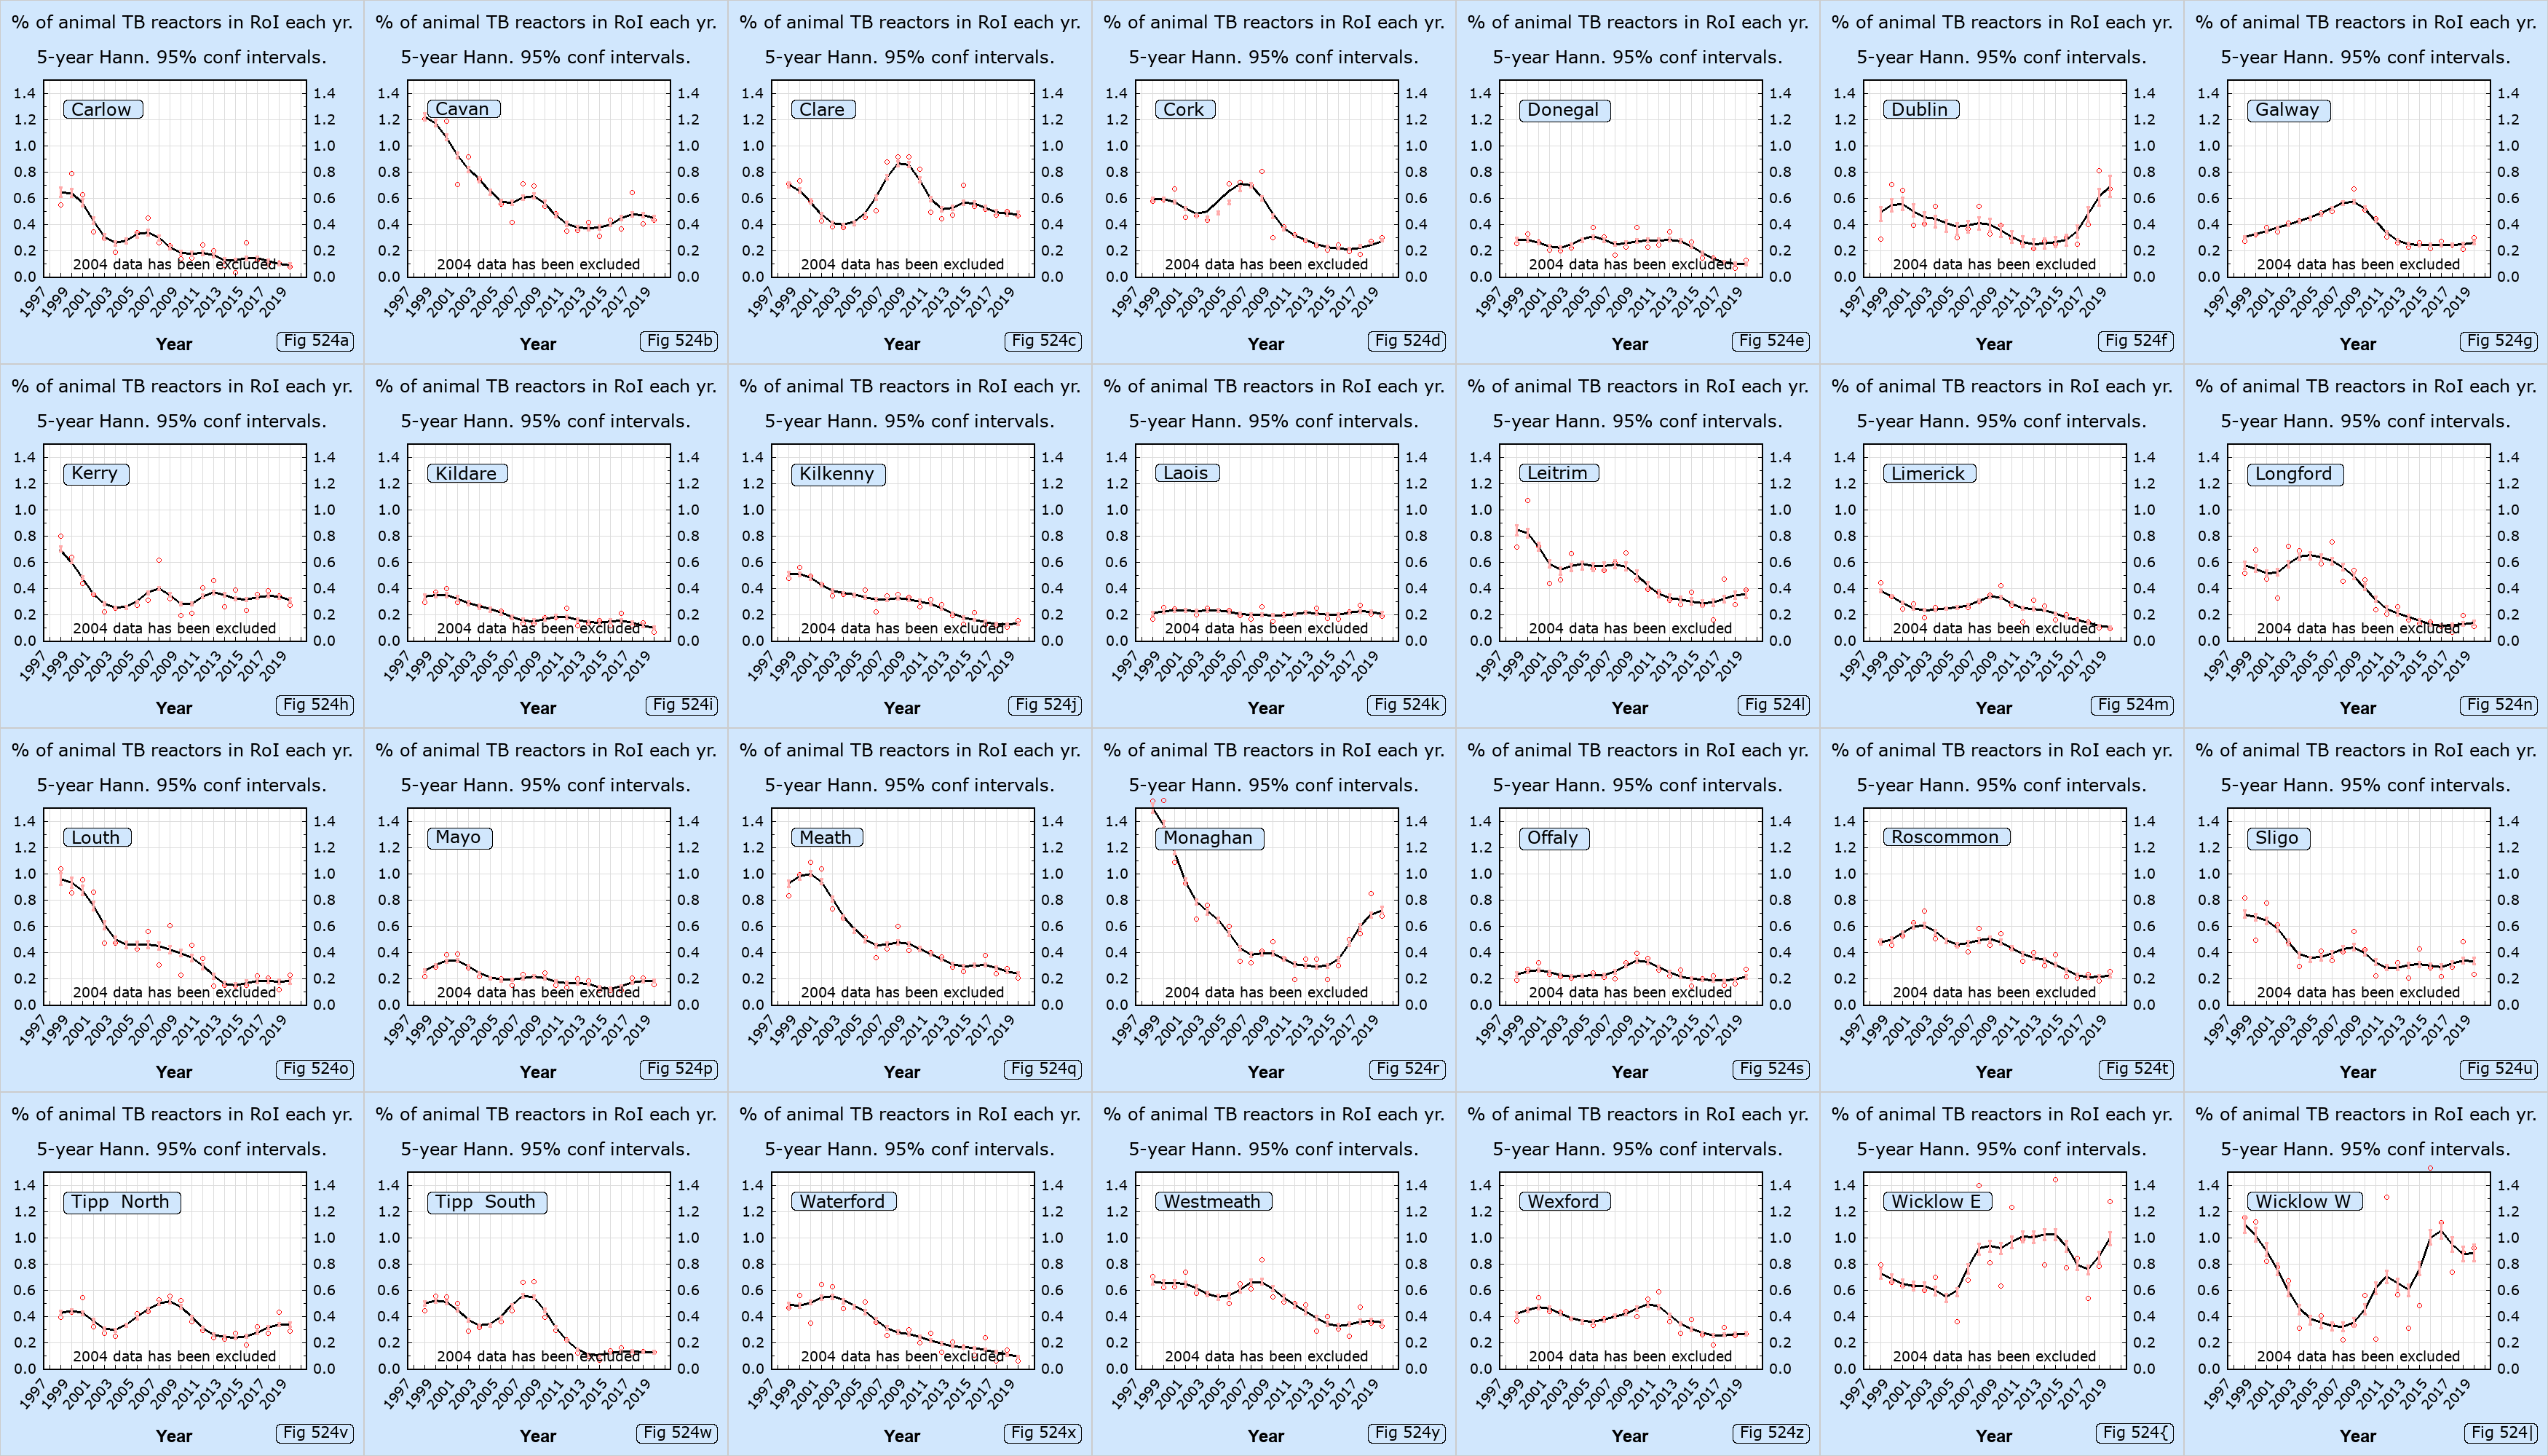
The data shown in the above graphs were downloaded from http://www.agriculture.gov.ie/animalhealthwelfare/diseasecontrol /bovinetberadicationandbrucellosismonitoringscheme/statistics/tbstats/. That page has been replaced by a page which no longer shows statistics for earlier years.
The influence of Foot and Mouth
Foot and Mouth occurred in 2001 and, as can be seen in the above graph, in the following 3 years TB infection levels increased substantially in Northern Ireland whereas they noticeably reduced in the Irish Republic. The extent to which TB testing was interrupted due to Foot and Mouth and the percentage of cattle which were culled in each country due to Foot and Mouth are shown in the tables below.| Irish Republic | Request (Sent 30May11) | Reply (Received 30Jun11) |
| Northern Ireland | Request (Sent 07Apr11) | Reply (Received 22Apr11) |
| Country | Number of months over which testing was suspended or reduced | Number of cattle culled due to Foot and Mouth | Number of cattle in the country | Percentage of cattle culled due to Foot and Mouth |
|---|---|---|---|---|
| Irish Republic | 1.5 | 1,181 | 6,408,000 | 0.02 |
| Northern Ireland | 1 | 50,565 | 1,679,100 | 3.01 |
| Great Britain | 911 | 581,80217 | 8,923,0006 | 6.52 |
In summary, TB testing was suspended for 4 weeks in Northern Ireland and 6 weeks in the Irish Republic. However Northern Ireland culled 3.01% of their cattle (50,565 cattle out of 1,679,100) whereas the Irish Republic only culled 0.02% of their cattle (1,181 cattle out of 6,408,000). It follows that there would have been a lot more cattle movements during restocking in Northern Ireland than in the Irish Republic. This probably caused significantly more cattle to cattle transmission of bovine TB in Northern Ireland and may explain why the prevalence of bovine TB increased much more in Northern Ireland than in the Irish Republic.
The influence of culling
The following graph shows the number of badgers (reported by DAFF) which have been culled in the Irish Republic each year between 1995 and 2016.51The following graph shows the number of cattle reactors and badgers removed in the Irish Republic.
If 6,000 badgers are removed each year and the total area of the Irish Republic is 70,273 km2, then the number of badgers being removed each year is 0.085 badgers / km2. The average life expectancy of a wild badger is thought to be 4 years and they are thought to exist at about 1 badger / km2.
Ref 41 studies the dynamics of badger populations in Ireland and is dated January 2013. It concludes with the following statement.
From a conservation perspective, our analysis suggests that badger populations have been greatly reduced over large areas of the Irish countryside (31% of the area of the counties in the present study). Despite this, badgers are continually caught at setts even after recurrent capture attempts over multiple years. This indicates that a likely source-sink dynamic is in place.
Regarding the culling of badgers in another country (Germany) and population density between 2003 and 2007, Ref 42 states the following.
Since the end of gassing setts, the annual hunting bag has increased from less than 5,000 in the 1960s and 1970s to a stable level of about 50,000 since 2003.
Consider the differences between the proportions of cattle culled in Northern Ireland and the Irish Republic in the 5 years between 2008 and 2012 as presented in the table below. If these differences are due to culling alone, culling badgers in the Irish Republic would have saved on average 9,137 cattle each year.
| Year | Number of cattle in the Irish Republic | % of cattle culled in Northern Ireland | % of cattle culled in the Irish Republic | % difference | The number of cattle saved |
|---|---|---|---|---|---|
| 2008 | 6150163 | 0.517 | 0.486 | 0.03 | 1906 |
| 2009 | 6025656 | 0.513 | 0.395 | 0.12 | 7078 |
| 2010 | 5751564 | 0.399 | 0.351 | 0.05 | 2724 |
| 2011 | 5819281 | 0.512 | 0.318 | 0.19 | 11246 |
| 2012 | 6145469 | 0.671 | 0.301 | 0.37 | 22731 |
Average number of cattle saved each year = (1906+7078+2724+11246+22731)/5 = 9137
In 2012, the proportion of cattle slaughtered due to TB in the Irish Republic became less than half the proportion of cattle slaughtered due to TB in Northern Ireland. Although this situation existed between 2002 and 2004, this difference has increased over the last 2 years. Also in 2002 to 2004, unlike now, incidence in Northern Ireland may have been subjected to temporary high incidence levels due to relocation of TB-infected cattle after Foot and Mouth. If this gap continues to grow, it will become increasing likely that this difference is due to the badger culling policy which the Irish Republic have been increasingly investing in since the mid nineties. This will be interesting because (as details show below) the Irish Republic are implementing a very localised badger culling policy. The Independent Scientific Group's interpretation of results of culling badgers between 1998 and 2005 in high cattle incidence areas of England was such that they concluded that localised culling in England risks increasing cattle incidence.10
The following gives some background on the theory which has been put forward to explain why this may happen. Cattle incidence in Great Britain between 1986 and 1998 significantly increased as is shown in the graph below taken from Reference 12. (Foot and Mouth occurred in 2001.)
In 1986 the culling strategy changed from that of 'clean ring' where badgers are first culled on land occupied by affected cattle herds, then on adjoining land, expanding outwards until no further infected animals were captured14, to one where badgers were only culled on the infected farm. (A history of English culling strategies is given on Page 5 of Reference 14 and also in Reference 10.) The proportion of diseased badgers during the RBCT10 was reported to double during the course of the trial15. The report in Reference 13 explains that in the Irish Republic, badger setts are first identified within 2 km of a tuberculosis-affected farm and then badgers are culled within a 500 metre radius of each sett. The aerial photographs shown on Page 13 of this report show that this distance is typically equivalent to about 3 or 4 medium size fields. If badgers are ranging more widely as a result of culling, greater interaction may be increasing disease levels in badgers. Such perturbation however is only thought to exist in badger populations where badgers exist in social groups. In more favourable habitats where population density is high, badgers form into social groups.30 Badger population densities in Ireland may be considerably less than in Great Britain16. If social grouping is also less extensive then perhaps perturbation is less significant. Unfortunately estimating a badger population is very difficult and estimates for Ireland have varied over a very wide range.31 If the culling is causing perturbation and increased disease levels in surviving badgers, this will be to a certain extent offsetting the benefits of reduced frequency with which cattle come into contact with less densely populated badgers.
Why is the Irish perspective to culling so different from that in the UK?
5% of the Irish population is employed (current June 2013) in agriculture whereas in the UK the proportion is only 1.4%.33 However of greater significance than this is the fact that the number of dairy producers per 1000 head of population in the Irish Republic is about 25 times greater (current in 2011) than that in England.| Quantity | Year | Value |
|---|---|---|
| Number of dairy producers in RoI38 | 2011 | 19,167 |
| Size of population in RoI40 | 2011 | 4,588,252 |
| Number of dairy producers in England37 | 2011 | 8,928 |
| Size of population in England39 | 2011 | 53,012,456 |
Number of times the number of dairy producers per 1000 head of population is greater in RoI than in England = (19167/4588252)/(8928/53012456) = 24.8
In the Irish Republic, the agri-food industry is an important sector of the Irish economy. According to Reference 34, in the Irish Republic about 70% of the total land area is utilised for agricultural purposes (including forestry). Cattle-raising and dairying are by far the most important sectors of the agricultural industry, and livestock (mainly cattle) and livestock products (principally milk), accounted in 2006 for 76 per cent of the value of gross agricultural output. However the prominence of agriculture in the Irish economy is in decline35.
In the UK, agriculture is intensive, highly mechanised, and efficient by European standards, producing about 60% of food needs with only 1.6% of the labour force. Around two thirds of production is devoted to livestock and one third to arable crops.36
There is a substantially greater dependence and connection with farming (dairy farming in particular) in the Irish Republic. It follows that more people in Ireland have a better insight into farming and the impact which bovine TB is having on farming.
References
- An all-island approach to mapping bovine tuberculosis in Ireland by G McGrath et al published in 2009
- Great Britain and Republic of Ireland badger culling trials: An initial comparative study by C.M O'Connor et al, University of Glasgow
- Tuberculosis in cattle and badgers in United Kingdom. Report to the Standing Committee, 23rd meeting, Convention on the Conservation of European Wildlife and Natural habitats (Bern Convention). Strasbourg, 26 November, 2003
- Sleeman et al., 2009. How many Eurasian badgers Meles meles L. are there in the Republic of Ireland? Eur J Wildl Res DOI 10.1007/s10344-008-0244-1
- Department of Agriculture and Rural Development - Badger Survey of Northern Ireland 2007/08 - Quercus Project QU07-13
- Number of cattle in England, Wales, Scotland, Northern Ireland, Great Britain and the UK for each year from 1866 to 2010
- Functions of the Wildlife Administration Unit (WAU) in Johnstown Castle, Wexford
- Scotland declared TB-free
- Four Area Badger Culling Trial in the Irish Republic
- Final Report of the Independent Scientific Group on Cattle TB
- Number of animals tested and slaughtered due to bovine TB
- Government Veterinary Journal
- Eradication of bovine TB in the Irish Republic including a detailed description of badger culling and vaccination strategy. Released in April 2010.
- The effects of annual widespread badger culls on cattle tuberculosis following the cessation of culling - Supplementary Information. HE Jenkins et al. International Journal of Infectious Diseases Volume 12, Issue 5, Pages 457-465. September 2008.
- A critique of the Randomised Badger Culling Trial (RBCT)
- DEFRA consultation Sept 2010: Annex B - Scientific evidence on culling
- Numbers of cattle slaughtered per month by county in Great Britain due to Foot and Mouth
- Prevalence and transmission of bovine TB between cattle and badgers
- Bovine tuberculosis eradication in Ireland
- Cattle and calves in the UK from 1866 to 2012
- TB stats in the Irish Republic in 2011
- TB incidents in Great Britain to Nov 2012 - Animals (Archived and no longer available page at https://www.gov.uk/government/publications/incidence-of-tuberculosis-tb-in-cattle-in-great-britain)
- Reactors by month in Northern Ireland to Dec 2012
- Incidence of Bovine TB in Great Britain to 2011
- Incidence of Bovine TB in Northern Ireland to 2012
- Incidence of Bovine TB in the Irish Republic to 2012
- Number of bovine TB reactors slaughtered in Northern Ireland from 1961 to Nov 2011
- TB Statistics - Department of Agriculture, Food & the Marine, Ireland
- Animal Disease Statistics - Department of Agriculture and Rural Development, Northern Ireland
- The European badger - Revised October 2011
- Shining a light on the secret life of the Irish badger. MICHAEL VINEY. The Irish Times - Saturday, June 30, 2012.
- TB stats to 2012 for the Irish Republic. Department of Agriculture, Food and the Marine. ERAD Division. Reply to request. Sent 09 May 2013.
- LABOR FORCE - BY OCCUPATION in different countries. Central Intelligence Agency. USA Gov. June 2013.
- ECONOMY OF THE REPUBLIC OF IRELAND. Wikipedia. 2006.
- ECONOMY OF THE REPUBLIC OF IRELAND. Wikipedia. June 2013.
- ECONOMY OF THE UNITED KINGDOM. Wikipedia. June 2013.
- Dairy Producers in England and Wales. Source: DHI / Food Standards Agency. Supplied by DairyCo. April 2002 to June 2013.
- EU DAIRY PRODUCER NUMBERS. DairyCo. Published 22 January 13.
- Residents (millions) by UK country. Source: Office for National Statistics, Northern Ireland Statistics and Research Agency, National Records of Scotland. 2011.
- Population of the Irish Republic for each Province, County and City. Central Statistics Office. 2011.
- Studies relating to the population dynamics of the European badger (Meles meles) in Ireland. AW Byrne. Doctoral thesis. University College Cork, School of Biological, Earth and Environmental Science. January 2013.
- The German wildlife information system (WILD): Population densities and den use of red foxes (Vulpes vulpes) and badgers (Meles meles) during 2003-2007 in Germany. Institute for Wildlife Research, Veterinary Medicine University of Hannover. O Keuling et al. European Journal of Wildlife Research 57, 1 (2010) 95-105.
- Great Britain. Wikipedia, the free encyclopedia
- Irish Republic. Wikipedia, the free encyclopedia
- Northern Ireland. Wikipedia, the free encyclopedia
- Badgers and Bovine Tuberculosis 2009 by the Mammal Society
- The Badger and Habitat Survey of Ireland. C SMAL. 1995.
- Monitoring regional changes in badger numbers. Central Science Laboratory. Project Code WM0310. Project start: 01 November 2005. Project end: 31 May 2006.
- Republic of Ireland. Wikipedia. Last modified: 18 October 2013.
- DAERA begins consultatation on proposals to eradicate TB - Farming Life. Published 30 November 2017.
- Badgers removed in the Irish Republic