Randomised Badger Culling Trial: Was there an overall TB increase in the adjoining lands?
First published 17Sep2017.This article examines TB increases seen by farmers farming in RBCT areas adjoining culled areas. Prof Woodroffe on 14th September 2017 in the New Scientist described what happens when badgers are culled as follows. If the following text is clicked, the quote will be shown in context.
The trial showed that culling led badgers to roam more widely, increasing transmission within their own population and infecting cattle over wider areas. Efficient, well-coordinated culling has the potential to somewhat reduce cattle TB inside large cull zones, but this comes at the cost of increased TB on adjoining land. Small, patchy or inefficient culls can ,worsen the problem. Neither form of culling can eradicate the disease, because both increase TB within the badger population and spread infection to new areas.
The perturbation effect described above is plausible and may significantly limit TB reductions in cattle herd breakdowns which result from culling badgers. However did farmers who farmed in these adjoining lands see TB increase?
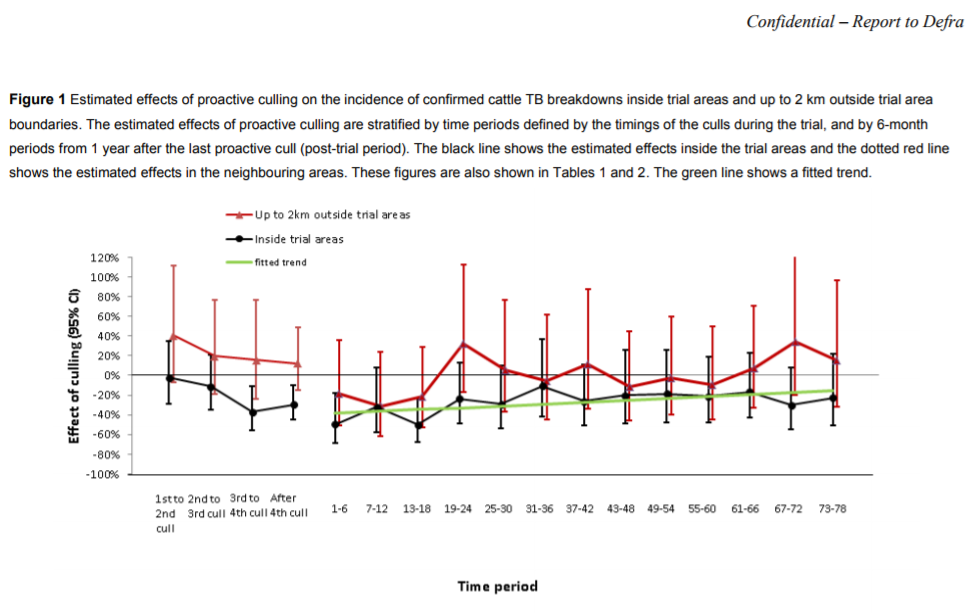
The following graph has been extracted from a report stamped "Confidential - Report to Defra". That report reports on work carried out from 2011 to 2013 in DEFRA project SE3279 titled "Further statistical analysis of the Randomised Badger Culling Trial".
The red line shows the effect of culling in treated areas on TB breakdowns in adjoining lands. These adjoining lands consisted of a 2 kilometre ring surrounding each treated area. The data shown in the plot is adjusted to account for conditions in the 3 years prior to when culling commenced. For instance 1,981 badgers were removed in the 13 years between 1986 and 1998 in the proactive areas. To put this in perspective, 8,910 badgers were removed in these areas during the RBCT in the 8 years between 1998 and 2005.
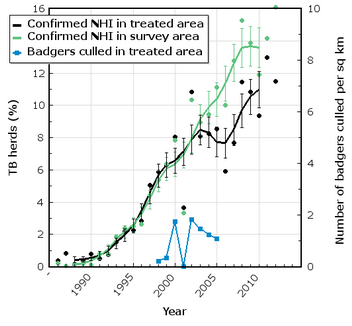
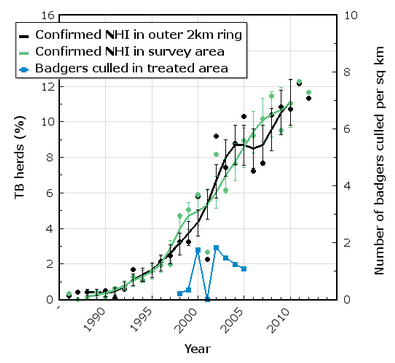
The following graphs again show confirmed new cattle breakdowns but they show raw data plotted against calendar year. The graph on the left shows TB breakdowns in the treated areas and the graph on the right shows TB breakdowns in the adjoining lands (the outer 2km rings). This data was supplied by the Animal and Plant Health Agency in response to Freedom of Information request ATIC0693. Although the data is unadjusted for conditions pre-cull, data is shown covering the pre-cull years. Clicking the thumbnail of each graph shown below will present a detailed explanation of what that graph shows.
Data is presented from 1986. Culling operations in the RBCT trial started 12 years later in 1998 (in certain areas only) and no culling was performed after 2005. Although perturbation may be real and limit the beneficial impact of culling, the graph on the right suggests that such an effect did not result in an overall TB increase on land adjoining where badgers were culled. In fact farmers in these adjoining areas may have seen overall TB reduce slightly when all years to 2012 are considered. So unless pre-cull conditions had large impact and large adjustments were necessary, the RBCT did not demonstrate that badger culling comes at the cost of increased TB on adjoining land.
The RBCT data released by APHA in 2016
- covers a wider date range than presented by Prof Woodroffe and her peers,
- for the first time includes period prevalence as well as incidence,
- is downloadable from the DEFRA web site (click here for data broken down by triplet in ATIC0921), and
- was initially released in combined form (ATIC0693) by APHA in March 2016 which is now 18 months ago.


