
Data needed to achieve meaningful results in the 2013 badger culls
Summary
In England an exercise started in 2013 to remove badgers to achieve a reduction in bovine TB in cattle herds. This article looks at the impact of removing badgers in the Randomised Badger Culling Trial (RBCT) to estimate when meaningful results can be expected in that exercise.Some details
This article was written in April 2018. For the purpose of distinguishing culls in the RBCT from the culling exercise which started in 2013, the culls will either be referred to as the RBCT culls or the current culls. Also year will always refer to the badger year. This starts on 1st February and ends on 31st January in the following year. Area will always refer to the licensed area. This area is the total encompassed area and will exceed the accessible area. This licensed area is referred to as the treatment area in the RBCT Final Report.2Results obtained in the RBCT
The following graph compares the percentage of cattle herds which are confirmed new incidents in RBCT treated areas with the percentage in RBCT survey-only areas. Each point on the line is smoothed across 5 years of data using a Hann window.1 The image is a thumbnail so click it to view at full size.In the above graph TB herds data were released by the Animal and Plant Health Agency (APHA) in response to Freedom of Information request ATIC0693 in March 2016. Number of badgers culled per square kilometre were calculated from numbers shown in the RBCT Final Report2.
Estimate of the number of years of data needed
In the RBCT, badgers were culled proactively across a total area of 1132 km2 comprising 10 nearly equal areas. Judging by the data displayed in the above graphs, the first year in which the smoothed incidence dropped by an amount, which is unlikely to be due to sampling, is 2005. In terms of data, if data is being averaged across 5 years, data is needed up to 2007 to plot the point for 2005 on that smoothed line. The first year in which culls were implemented across the whole area was 2002. Hence 6 years of data of whole-area, badger removal is needed. That is for 2002, 2003, 2004, 2005, 2006 and 2007. In the culls which started in 2013, badgers were culled in Gloucestershire and Somerset across a total area of 567 km2 which is about half the total area of the RBCT. This area also comprises just two separate areas as opposed to the RBCT's ten. Both the reduced area and number of areas involved is likely to extend the timescale needed to obtain a meaningful result. In addition to this, badgers were culled in the RBCT in 7 of the 10 areas before 2002. This may have caused benefits to appear earlier in the RBCT . However if these 3 issues are assumed to have no impact, it is likely that 6 years of data in the current culls will need to be incorporated into an analysis before meaningful results are seen. That is for years 2013, 2014, 2015, 2016, 2017 and 2018. For the reasons quoted, and perhaps others, this is likely to be an under-estimate of the time needed.Extent to which incidence is expected to drop
The extent to which TB incidence will drop will depend on the extent to which badgers are being removed compared to how they were removed in the RBCT. Badger removal in each area are compared to the removal in the RBCT in the following charts. Both are thumbnails, so click them to view at full size.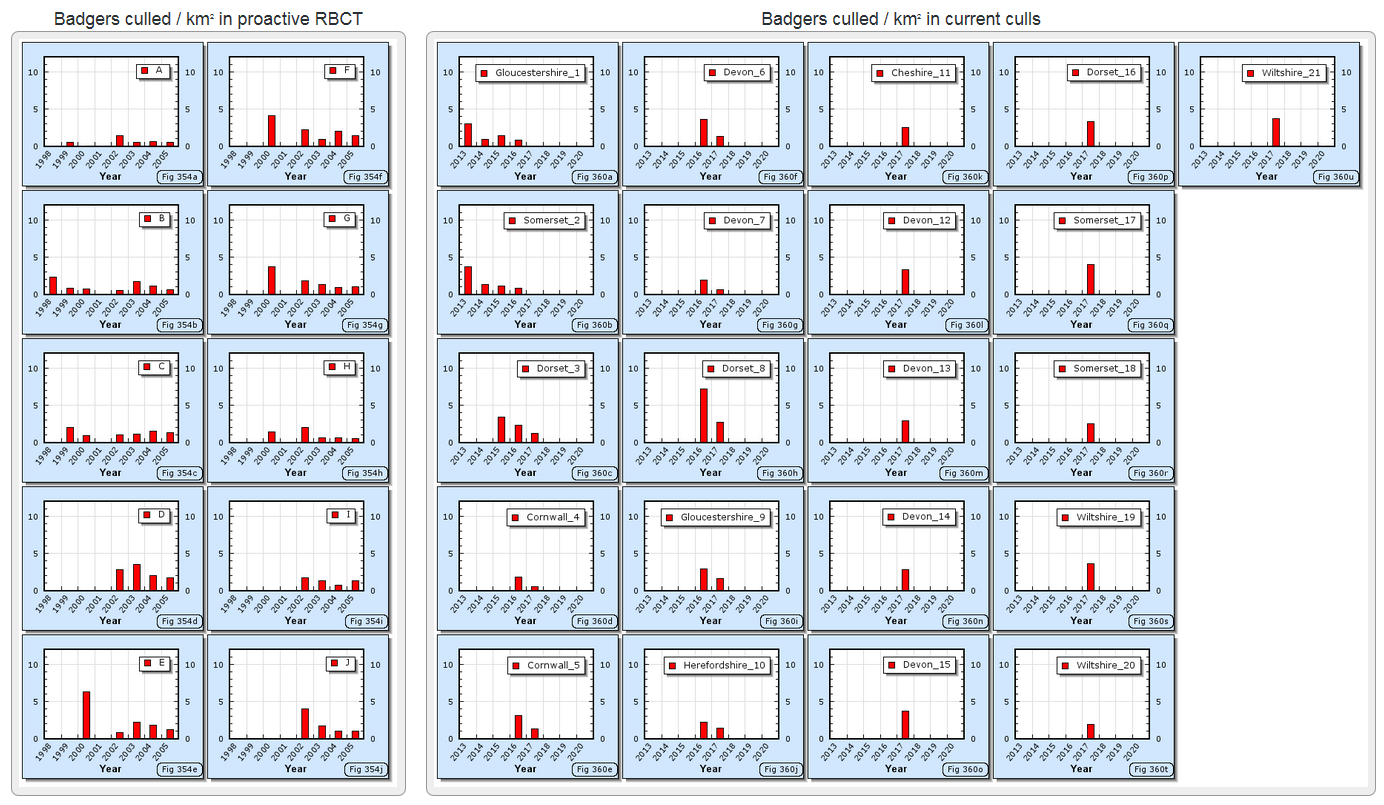
In the above charts, RBCT cull data was extracted from the following sources,
Page_10_of_Ref_3
Table_2.4_of_Ref_2
Appendix_D_of_Ref_2
and current cull data was extracted from the following sources,
RFI4007_Sheet_Q3
Badger Culling: Controlled Shooting Pilots. SN/SC/6837. E Ares. 11 January 2015.
Summary of badger control monitoring during 2014. DEFRA. December 2014.
Summary of badger control monitoring during 2014. DEFRA. December 2015.
Summary of badger control monitoring during 2016. DEFRA. December 2016.
Summary of badger control monitoring during 2017. DEFRA. December 2017.
In the above graphs, RBCT data was extracted from Freedom of Information Request ATIC1248 (Appendix 1) and the RBCT Final Report2. Current cull data were extracted from the sources listed earlier.
Regarding the RBCT, the slow rate at which numbers increased in the RBCT in the early years is largely due to culling not being performed across all the areas. For instance in 1998 culling only took place in one of the ten areas. Operations lasted for 4 years in only 3 of the 10 areas. In the remaining 7 areas the operations lasted between 5 and 7 years. No culling took place in 2001 because of Foot and Mouth. Badgers were removed across all 10 areas from 2002 onwards. The effectiveness of the badger removal operations should be assessed not only by the ultimate accumulated number of badgers removed but also by the rate at which badgers were removed. In years in which badgers were removed in all areas, that is from 2002 onwards, this is given by the steepness of the line. Obviously effectiveness needs to be judged in this way because badgers reproduce. They live on average for 4 years.
Regarding the current culls, if the number of badgers removed for dorset_8 are actual, it is clear that the number of badgers removed in that area have exceeded the number removed in the RBCT. This was achieved in just 2 years. The size of the 21 areas culled in 2017 varied considerably ranging from 198 km2 to 1030 km2. As such the largest area fell just short of the total area culled in the RBCT (1132 km2). If the number removed in 2018 in dorset_3 matches that removed in 2017, the number removed in dorset_3 will also reach the number removed in the RBCT in 4 years.
The relationship between incidence drop in the RBCT and the current culls depends on whether the overall badger population was greater at the start of the culls than what it was at the start of the RBCT. Also the size of the badger population will vary considerably between areas. This also applies to the level to which badgers are infected. Both these factors will influence the impact of any given reduction in badgers per square kilometer in any specific area.