
An example of how badger culling in the UK is being cast in a negative light
First published 16Sep2017.On 14 Sep 2017 a comment by Prof Woodroffe appeared in the New Scientist titled Killing thousands more badgers won't eradicate TB in cattle. Numerous previous articles in the scientific press and news media have appeared in which Prof Woodroffe has expressed her opinion. Such comments typically follow very shortly after a new year of badger culling is announced. Prof Woodroffe played a key role in the management and reporting of the 10-year Randomised Badger Culling Trial (RBCT) so her background and experience makes her an authority on the scientific case for culling badgers. As such it is understandable that her views carry influence. The following expresses my concerns regarding how Prof Woodroffe and her peers portrayed the impact of badger culling in the RBCT. These concerns focus on a paper published in 2010. The RBCT Final Report was submitted to the Minister of State in 2007. However in 2007 RBCT benefits were still building. By 2010 a clearer picture was available of the impact and this is when Prof Woodroffe and her peers gave a more detailed assessment of badger culling and its cost effectiveness.
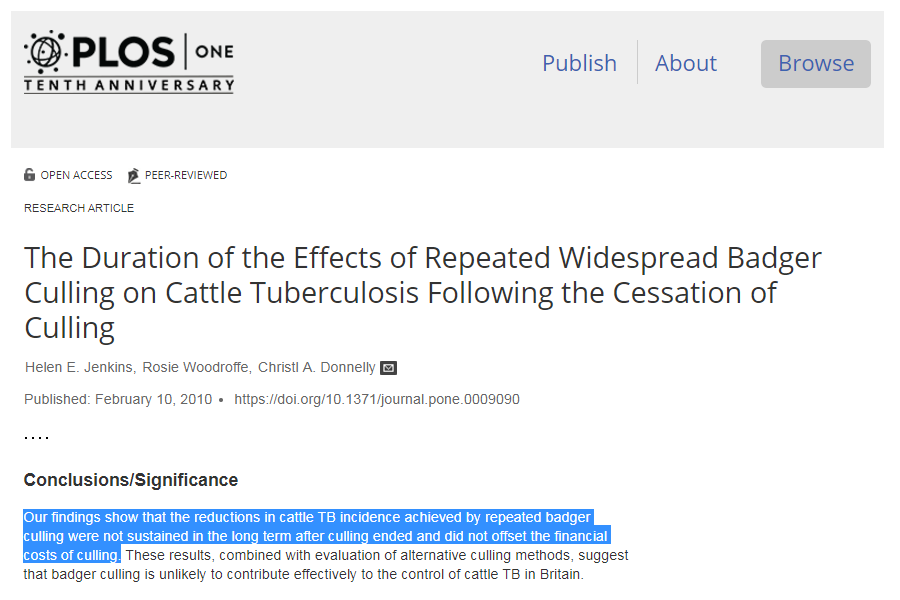
In that 2010 paper, Donnelly, Woodroffe and Jenkins clearly stated that TB reductions as a result of the RBCT trial were not sustained. The following thumbnail shows what they said.
This paper was summarised in a News and Events article published by Imperial College London in order to reach and cater for a wider audience.
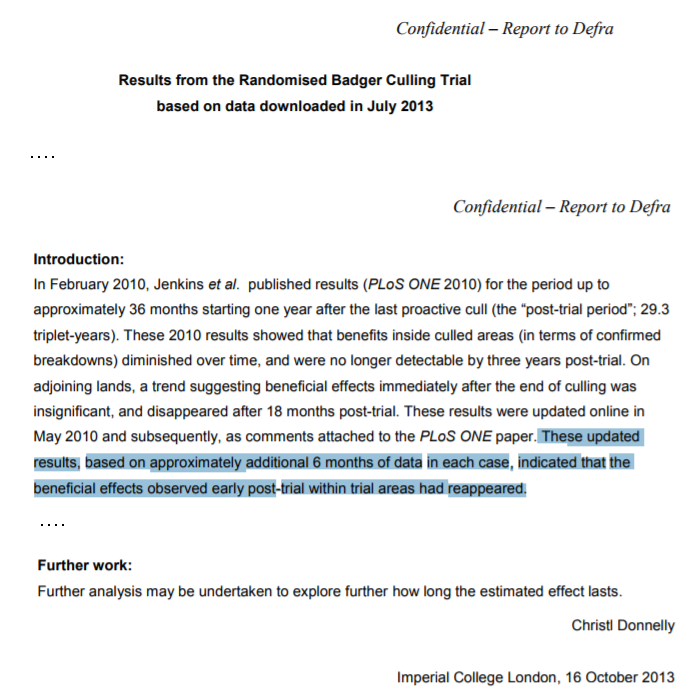
Then 3 years later a less publicised report was submitted saying that the beneficial effects had "reappeared". This report has the words "Confidential - Report to Defra" clearly visible at the top of each page.
So, what was the basis for widely publicising in 2010 that the TB reductions were not sustained?
The last point on a graph showing TB reduction plotted against reporting period in the 2010 paper implies that the benefit had reduced to nothing. This graph is shown below. Added to this graph is a label which draws attention to a large confidence interval associated with that last point.
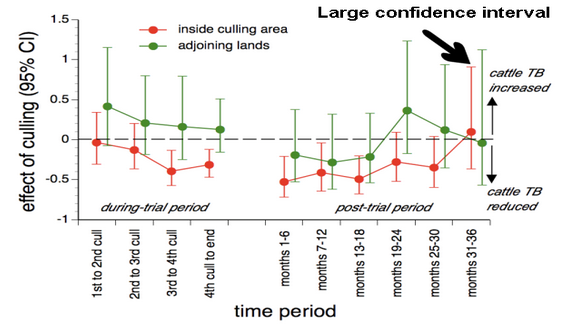
This interval was in fact much larger than that of all preceding points on that line and far too large to infer with confidence that TB reductions were not sustained. Was this the basis for saying so in the 2010 paper? If so, why was this not picked up in the peer review?
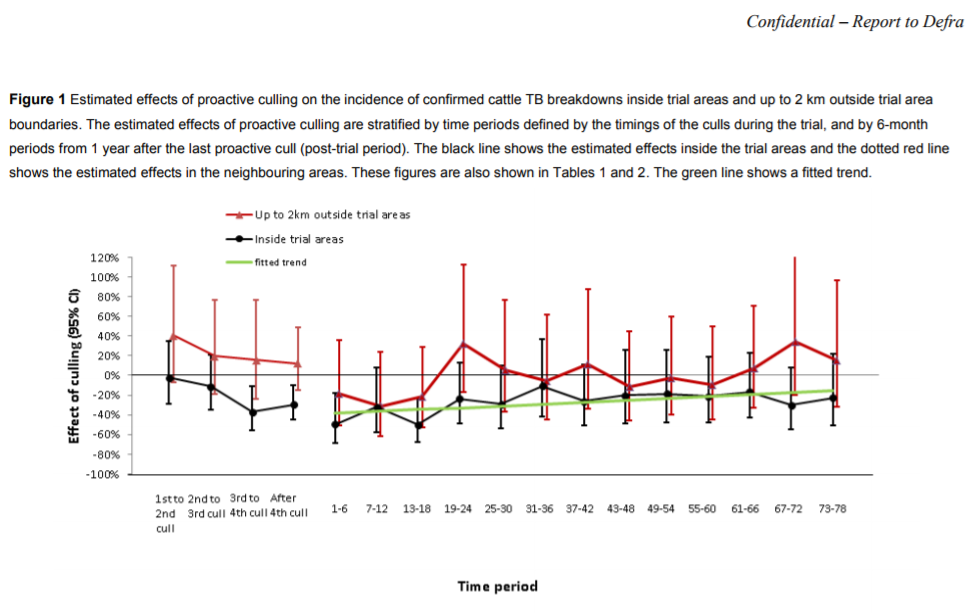
Benefits from the cull did continue. In fact they followed the course of the points which preceded that last data point. This can be seen in the following graph which has been extracted from the report labeled "Confidential - Report to Defra".
The following graph shows the data plotted against calendar year using raw unadjusted data supplied by the Animal and Plant Health Agency in response to ATIC0693. If the thumbnail shown below is clicked, a page will appear with a detailed explanation of what the graph shows.
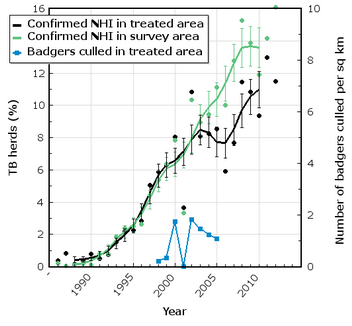
The data shown in the above graph combines data from all ten triplets. The same data, but broken down by triplet, can be downloaded by clicking on the following links to the DEFRA web site.
DATA SUPPLIED BY DEFRA IN RESPONSE TO FOI REQUEST ATIC0921
A description of the data supplied and how to interpret it.An Excel spreadsheet containing the data.
DEFRA's TB eradication strategy now includes a rolled-out culling of badgers. This prompts the following questions.
- Why has the report released in 2013 been stamped with the words "Confidential - Report to DEFRA" at the top of every page?
- Why has more effort not been made to establish how long culling benefits in RBCT areas are lasting?
- Why has it not been made clear that the costings stated in that 2010 paper are likely to be misleading?
For other pieces of work which raise questions, see also