
Effect of culling on TB infection in badgers
Summary
A major concern with the culling of badgers is that the culling of badgers is thought to substantially increase TB infection in badgers. This can result in increased transmission of infection from badgers to cattle and result in the culling of badgers making TB in cattle worse. This article illustrates data acquired in the Randomised badger Culling Trial (RBCT) to examine the basis for this concern. This work found that between 2000 and 2002, when Foot and Mouth occurred, the proportion of culled badgers detected with TB infection tripled. However TB levels remained relatively stable in years either side of Foot and Mouth.The claim
The following shows an extract taken from the RBCT Final Report published in 2007 (Page 78 of Reference 1). The work on which this claim is based is described in Reference 7.
Effects of culling on M. bovis infection in badgers
4.26 Culling profoundly altered the prevalence and distribution of M. bovis infection in badgers. Statistical analyses adjusting for variables such as age, sex, triplet, and various measures relating to the probability of detecting infection, revealed that prevalence rose on successive proactive culls (Woodroffe et al., 2006b). Overall, by the fourth cull the prevalence of infection was approximately double that recorded on the initial cull (odds ratio 1.92, 95% confidence interval 1.51-2.45) after adjusting for other factors (Woodroffe et al., 2006b). Because of this rise in prevalence, the reduction in the density of badgers achieved by proactive culling was not associated with an equivalent reduction in the density of infected badgers.
4.26 Culling profoundly altered the prevalence and distribution of M. bovis infection in badgers. Statistical analyses adjusting for variables such as age, sex, triplet, and various measures relating to the probability of detecting infection, revealed that prevalence rose on successive proactive culls (Woodroffe et al., 2006b). Overall, by the fourth cull the prevalence of infection was approximately double that recorded on the initial cull (odds ratio 1.92, 95% confidence interval 1.51-2.45) after adjusting for other factors (Woodroffe et al., 2006b). Because of this rise in prevalence, the reduction in the density of badgers achieved by proactive culling was not associated with an equivalent reduction in the density of infected badgers.
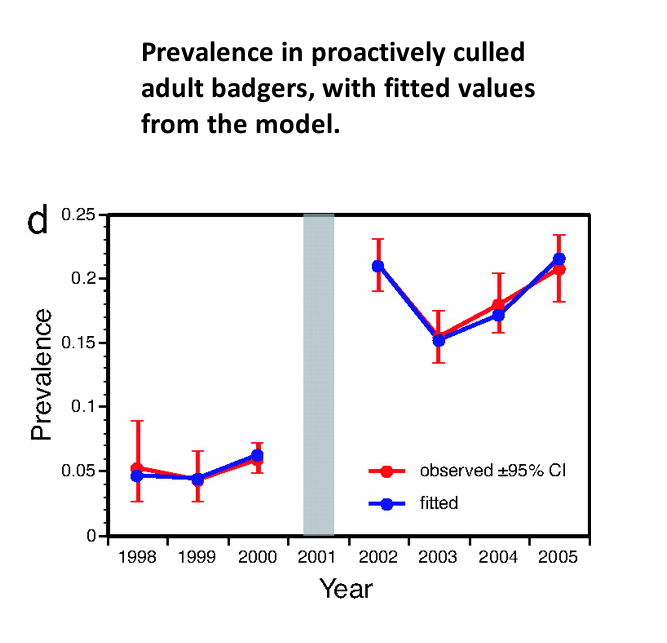
The following graph has been extracted from the work in Reference 7.
The challenge
THE RBCT Final Report1 states the following on Page 41 in Section 2.31.
In
addition
to fieldwork capability, the trial was to make substantial demands
on laboratory capacity within the Veterinary Laboratories Agency (VLA), who were to
undertake the post mortem examination of badger carcasses as rapidly as possible after
they became available from culling operations, along with tissue sampling, culturing
and genetic typing of
M. bovis
infection when discovered. This in turn necessitated the
provision of additional resources, not only of laboratory staff but also the appropriate
facilities required by Health and Safety regulations.
The overgrowth of normal post mortem bacteria affects ability to culture TB significantly. RBCT datasets2,3 show if the number of days between chilling and necropsy exceeded seven. In 1999 and 2000 this applied to 98% of stored carcases. Badgers trapped between August 1999 and March 2000 had to be frozen following instructions from the Health and Safety Executive.4
A percentage of carcases (9·15% of total carcases) had to be stored (either chilled at 0-4ºC or frozen at -20ºC) for more than 7 days prior to necropsy. Ninety-eight percent of these stored carcases were in 1999 and 2000 with the remainder in 1998 and 2002. Badgers trapped between August 1999 and March 2000 had to be frozen following instructions from the Health and Safety Executive. At other times they were stored frozen when the rate at which they were culled and delivered exceeded that at which they could be examined. There is evidence that such storage may reduce the sensitivity of detecting M. bovis by culture [18].
The RBCT Final Report1 states that when carcasses were stored for greater than 7 days before necropsy, they were almost always frozen.
Guidelines5 issued by the United States Department of Agriculture in 2011 states the following. These guidelines imply a concern when the delay between death and postmortem reaches 24 hours. As such a delay which often reached 7 days in the case of badgers in the RBCT would be expected to substantially inhibit the ability to detect TB.
General Recommendations
Despite the stringent decontamination protocols used in the laboratory, tissue specimens can still be overgrown by environmental fungi and bacteria, thereby impeding the ability to recover any viable mycobacteria present in the tissues. To minimize overgrowth, it is important to collect tissues from the animal as soon as possible post mortem. Collect tissues from animals within 2 hours whenever possible. If the animal has been dead for more than 24 hours, contact the laboratory prior to submitting samples for histopathology.
Despite the stringent decontamination protocols used in the laboratory, tissue specimens can still be overgrown by environmental fungi and bacteria, thereby impeding the ability to recover any viable mycobacteria present in the tissues. To minimize overgrowth, it is important to collect tissues from the animal as soon as possible post mortem. Collect tissues from animals within 2 hours whenever possible. If the animal has been dead for more than 24 hours, contact the laboratory prior to submitting samples for histopathology.
The data
Detailed data describing badgers culled and their circumstances can be downloaded from Reference 2 and 3. The tables in References 2 and 3 refer to 8,863 of the 8,910 proactively culled badgers and 2,064 of the 2,069 reactively culled badgers reported in the RBCT Final Report.1 Although badger trapping did take place in January 2001 in triplets C and E no badger data for year 2001 is included in the data sets referred to in References 2 and 3. This is because each badger year went up to the end of January in the next calendar year. Badger year is shown along the x-axis of the graphs shown below so no badgers were culled in year 2001. That is why that year is omitted from the graphs.Examination of how the prevalence of TB infection in badgers changed with year
The following graph shows the proportion of badgers culled in the RBCT which were found to be infected using the data described above. 95% confidence intervals are also shown.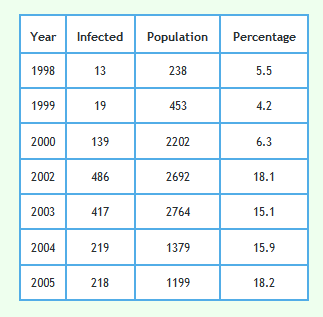
The following graph shows the proportion of all badgers in the proactive triplets only which were found to be infected including those for cubs.
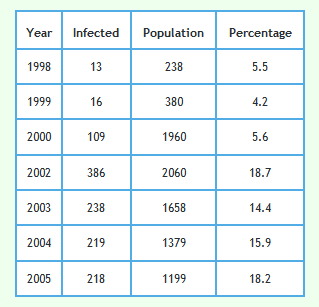
The graph below shows proactively culled badgers again but excluding cubs. Although the differences are subtle, unlike the lines in the above grapth, the lines on this graph exactly overlay with the observed lines shown in Fig 1d of Reference 7.
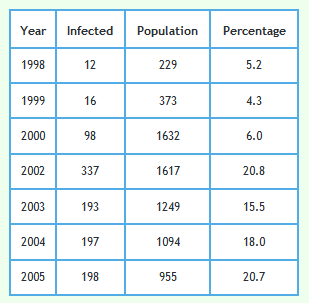
The following graph shows the proportion of badgers in the reactive triplets.
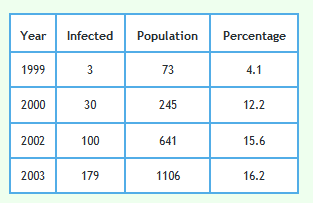
Please note that in 1999 only 3 badgers culled in 73 were detected to have TB. This would have made sample error very large and very little reliance can be placed on the TB level found in this year. To a lesser extent the same applies to the result in 2000.
Culling in the different triplets started in different years as shown in the following bar charts.
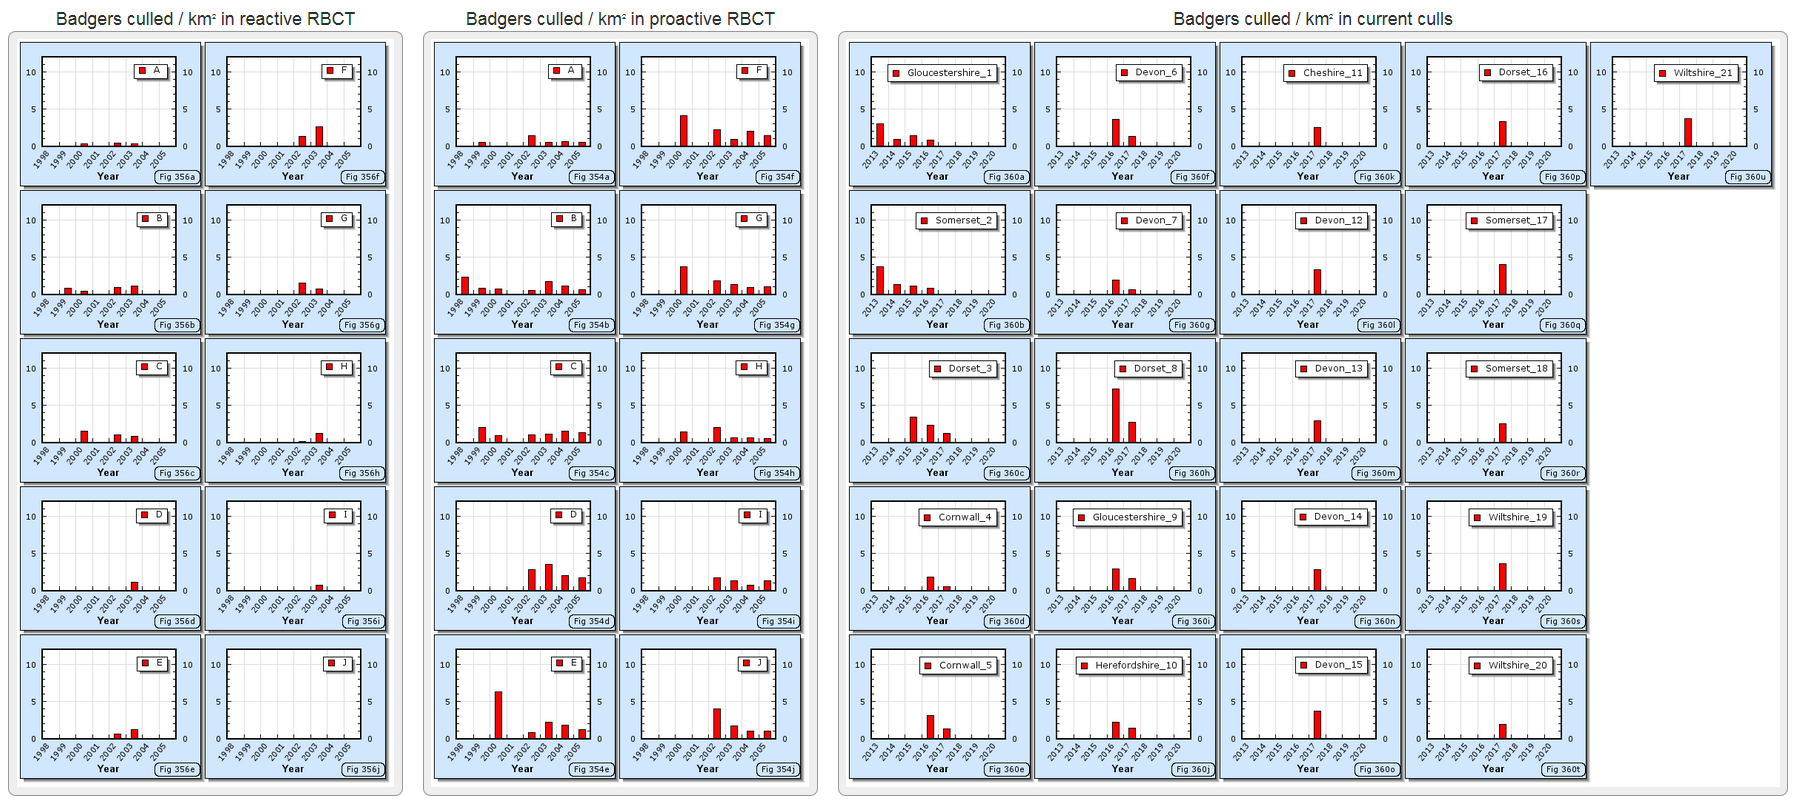
Culling in triplets E, F and G all started in the same year (2000) so should show a more consistent impact of culling when plotted against calendar year. The proportion of badgers infected each year in these triplets are shown in the following graph.
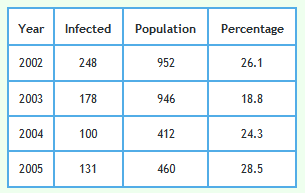
Foot and Mouth occurred in 2001. To reduce the impact of Foot and Mouth and bring any effect of badger culling into focus, the effect of culling in triplets D, I and J can be examined. Culling in these triplets started in 2002. Data from these triplets alone are shown in the graph below.
Examination of how carcass decomposition prior to post mortem was modeled
The RBCT Final Report1 (Page 78 in Section 4.26) states the following.
Effects of culling on M. bovis infection in badgers
4.26 Culling profoundly altered the prevalence and distribution of M. bovis infection in badgers. Statistical analyses adjusting for variables such as age, sex, triplet, and various measures relating to the probability of detecting infection, revealed that prevalence rose on successive proactive culls.
4.26 Culling profoundly altered the prevalence and distribution of M. bovis infection in badgers. Statistical analyses adjusting for variables such as age, sex, triplet, and various measures relating to the probability of detecting infection, revealed that prevalence rose on successive proactive culls.
The model was based on the data contained in the datasets listed by Woodroffe et al7, specifically the dataset for badgers culled proactively2. Decomposition of the badger carcasses in the model is represented by a simple binary taken from this dataset which indicates if the period the carcass was stored between chilling and necropsy exceeded 7 days.8 Is this adequate? The extent to which the carcass would have decomposed leading up to necropsy would not only have depended on the number of days between chilling and necropsy but also on the conditions under which the carcass was stored from date of death to necropsy. There are a number of observations which suggests that unaccounted-for conditions may have critically influenced the extent to which the carcass was decomposed at the time of necropsy. These observations are listed below.
- Introduction of Veterinary Investigation Service Instructions
After Foot and Mouth in October 2002 Veterinary Investigation Service Instructions for examination of badgers for the RBCT were first issued.9 These instructions were sent across regional laboratories to standardise various processes. This suggests that procedures in some laboratories prior to Foot and Mouth were lacking. - Inclusion of dates in DEFRA raw data
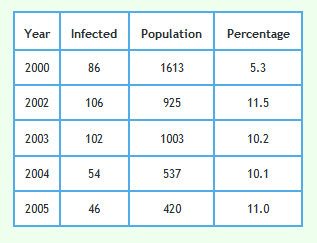
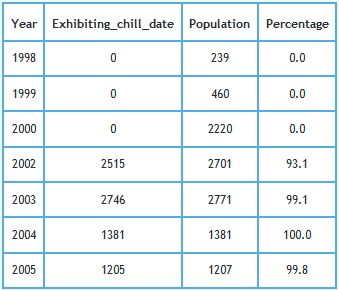
In modelling TB infection in badgers, data were initially supplied by DEFRA. If that data matched that supplied in response to ATIC124810,11, that supplied data was more detailed and included dates unlike the data on which the model was based. Dates which are perhaps important are the "initial chill date" and the "chill date". Such dates were added from 14th May 2002 onwards. The percentage of badger carcasses for which at least one of these dates were recorded in the data supplied by DEFRA is shown plotted and tabulated below.
Those dates were missing from all records logged in years prior to Foot and Mouth. Examination of dates logged after Foot and Mouth shows that the "initial chill date", when given, always matched the "date of death". When a "chill date" was given in the absence of an "initial chill date", the "chill date" either occurred on the "date of death" or failing that up to 3 days after the "date of death".This raises questions regarding when carcasses were chilled after date of death and how this regime compared before and after Foot and Mouth. - Stipulations imposed by the Health and Safety (H&S) Executive
H&S had to be called in to protect the health of staff working in the laboratories where carcasses were postmortemed (Jenkins et al4). This suggests that health risks associated with carcass decomposition had to be re-evaluated and stipulations put in place after badger culling started. Badger culling started in 1998 and the H&S Executive stipulated that badgers trapped between August 1999 and March 2000 had to be frozen. Unfortunately neither chill dates nor freeze dates were recorded before Foot and Mouth. Just over 90% of badgers before Foot and Mouth were culled after August 1999. - A sudden tripling in detected TB infection in badgers
As noted in the previous section, the percentage of badgers detected to be infected suddenly tripled between 2000 and 2002 during the lull in culling caused by Foot and Mouth. This sudden increase in detection is huge. It is unlikely that infection in cattle would have increased and would have transmitted to badgers to cause prevalence in badgers to triple in just 12 months.
- the sudden 3-fold increase in detected infection between 2000 and 2002,
- the freezing of badger carcasses prior to Foot and Mouth,
- doubts over when carcasses started to be chilled prior to Foot and Mouth, and
- the need to call in H&S and standardise operating procedures in some laboratories prior to Foot and Mouth
Discussion
Obviously something caused disclosed infection to triple between years 2000 and 2002. The RBCT Final Report in Reference 1 attributes increased TB infection in badgers to reduced testing on cattle for 11 months due to Foot and Mouth, a resultant increase in infection in cattle, and consequential increased transmission from cattle to badgers. However the tripling of detected infection between years 2000 and 2002 may have been largely due to an improved ability to detect infection in the fresher carcasses postmortemed after the lull caused by Foot and Mouth. Indeed the proportion of badgers found infected with TB remained relatively stable in years either side of Foot and Mouth. Although the model accounts for the number of days carcasses were stored, the model takes no account of the conditions under which the carcass was stored during these days. Indeed although the date on which chilling started was recorded after Foot and Mouth that date was not recorded for any carcass stored before Foot and Mouth. The model attributes the spike in badger prevalence in 2002 to increased transmission from cattle to badgers due to the delay in testing cattle in 2001 due to Foot and Mouth. How TB can suddenly increase in cattle and infection transmit to badgers in a space of 12 months to cause such a spike is questionable.Increased infection in badgers and the knock on effect of increased transmission to cattle is often used to add weight to the argument that the culling of badgers is ineffective and can actually make TB in cattle worse. This study has found that substantial demands were made on laboratory capacity to post mortem badger carcasses as rapidly as possible. Indeed the ability to recover any viable mycobacteria during post mortems is impeded by the overgrowth of environmental fungi and bacteria. This build-up is so quick that guidelines published by the US Department of Agriculture recommend post mortems are carried out within 24 hours. In the RBCT post mortems, the need to perform post mortems quickly necessitated the provision of additional resources, not only of laboratory staff but also of appropriate facilities which were required to meet H&S regulations. If the increased number of TB positives in badgers was due to an improved ability to detect TB as a result of these stipulations, actual infection in badgers may not have increased. The RBCT Final Report claimed that culling profoundly altered the prevalence and distribution of M. bovis infection in badgers. Did it?
Conclusion
If infection in badgers did not increase, this does not support the argument that the culling of badgers is ineffective and can actually make TB in cattle worse.References
- Final Report of the Independent Scientific Group on Cattle TB
- Supporting Data Set 1 extracted from http://www.pnas.org/content/103/40/14713.full?tab=ds. Culling and cattle controls influence tuberculosis risk for badgers. R Woodroffe et al. 2006.
- Supporting Data Set 2 extracted from http://www.pnas.org/content/103/40/14713.full?tab=ds. Culling and cattle controls influence tuberculosis risk for badgers. R Woodroffe et al. 2006.
- The prevalence, distribution and severity of detectablepathological lesions in badgers naturally infected withMycobacterium bovis. HE JENKINS et al. Epidemiol Infect. Oct 2008; 136(10): 1350-1361. Published online Nov 30, 2007.
- Guidelines for Surveillance of Bovine Tuberculosis in Wildlife. USDA. June 2011.
- RBCT badger details received from APHA in Februrary 2018 in response to FoI Request ATIC1248.
- Culling and cattle controls influence tuberculosis risk for badgers. R Woodroffe et al. www.pnas.org. Contributed by David R. Cox, July 26, 2006.
- Culling and cattle controls influence tuberculosis risk for badgers. R Woodroffe et al. www.pnas.org. Contributed by David R. Cox, July 26, 2006. Supporting Data Set Legend.
- EXAMINATION OF BADGERS FOR THE RANDOMISED BLOCK CULLING TRIAL. PROJECT SB4400. Veterinary Investigation Service Instructions 194 (FIRST ISSUE). Oct 2002.
- ATIC1248 Request.
- Data supplied by DEFRA in response to ATIC1248.