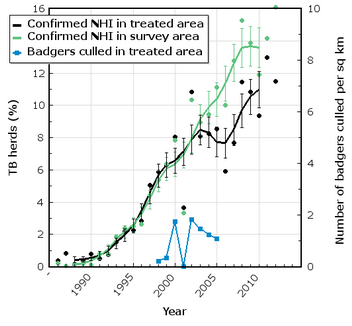
Confirmed New Herd Incidence in RBCT areas from 1986 to 2012
The graph below shows confirmed new cattle herd breakdowns, or New Herd Incidence (NHI), when combined from all ten RBCT triplets. These breakdowns are shown as a proportion of all cattle herds registered by the Animal and Plant Health Agency (APHA) in each area. These proportions were accrued over a year from the number of breakdowns and herds supplied each month by APHA from 1986 to 2012. APHA supplied this data in March 2016. The lines on the graph connect points which were calculated by passing the supplied numbers through a Hann window spanning 5 years (2 years on either side of the central point). The graph shows 95% confidence interval limits. It also compares data collected in the treated areas with data collected in the survey areas. Data in these survey only areas are shown in green. In such areas no action was taken and no badgers were culled.