
Bovine TB prevalence in Scotland and prospects for this to increase
In April 2012 the Farmers Guardian reported5 that 60 cattle were slaughtered due to TB in Scotland following one of the worst outbreaks of bovine TB in Scotland for several years. In addition to this, Farmers Weekly reported6 the followingEpidemiologists from the Animal Health Veterinary Agency are currently attempting to discover the source of the outbreak, which has been described as a "mystery" because the dairy herd was fully closed and no animals has been introduced to the farm since 1988.
Although the Scottish Herald reported7 that scientists had ruled out wildlife being behind the outbreak [Editor: How is this established?], the number of badgers may have substantially increased in Scotland in the last decade. In fact when the number of applications for badger control licenses in Wales and Scotland are compared over the last decade, the number of applications appear to have reduced in Wales but have increased by a factor of about 10 in Scotland. In fact the number of applications in Scotland now roughly match the number of applications in Wales. All these trends can be seen in the graph below.
Data shown in the above graph was taken from References 10, 11 and 12. The numbers of applications each year in Wales were calculated by summing the number of applications made to the Countryside Council for Wales11 and the Welsh government12.
It should be noted that numbers for Scotland may not have increased by a factor as great as 10. In fact if numbers for Scotland prior to 2001 are included, the numbers over 15 years have only increased by a factor of about 4. However this is still a substantial increase particularly when numbers for Wales have reduced over the last decade.
Care should be taken when looking at this data because an increase in the number of applications may be due to reasons other than an increase in badger numbers. Indeed the distribution survey of badger numbers carried out between 2007 and 2009 in References 8 and 21 reports that there is only a moderate badger population in Scotland, which appears to have increased since previous studies. However, if badger numbers are increasing, as the number of badgers increase so will the frequency with which badgers come into contact with cattle. If the badger population were to become infected, this increasing badger population would be expected to increase the incidence of TB in cattle. Professor Donnelly commented in Reference 9 that roughly 50% of bovine TB incidents could be attributed to infectious badgers. Professor Donnelly was deputy chair of the Independent Scientific Group during the Random Badger Culling Trial which was conducted between 1998 and 2005 and was jointly responsible for designing the trial. Her comment relates to the initial proactive badger culls in the trial. This trial was conducted in areas where (unlike in Scotland) the incidence of TB is high. As such the proportion of incidences attributable to badgers in Scotland would be expected to be significantly lower than 50% in areas where TB is not endemic in badgers. Currently Scotland's badgers are considered to be largely TB free.
However the climate in Scotland is becoming more suitable for supporting a growing badger population. Between 1961 and 2003 "growing degree days" have increased more rapidly in Scotland than in the more southern regions of the UK (see Fig 7 in Reference 13). Grass and pasture provide a rich habitat for earthworms which form a large component of a badger's diet14. Badger population dynamics are significantly affected by erratic weather patterns, a fact that makes these mammals vulnerable to potential impacts of climate change. Milder winters and longer springs/summers favour badger survival and increase the numbers of cubs born the next spring.16 However the winters of 2008/09, 2009/10 and 2010/11 saw large snowfall amounts widespread and very low temperatures.15. Graphs which plot Central England Temperature clearly show how the temperatures in England plummeted during these years. Conversely, Fig 67 shown below shows how temperature, when smoothed over 10 years, has increased since the mid 1980's.
This is a good illustration of climate change and it is widely believed that these long-term temperature increases will continue.
It should also be pointed out that the prevalence of bovine TB in cattle in Scotland is very low as shown in the following graph.
In the above graph the percentage of restricted herds was calculated by dividing the number of herds under TB movement restriction (non-OTF) by the total number of herds.
The following graphs show the incidence in cattle rather than in herds. They were generated from data in References 1 and 2.
Wigtown county has had the highest levels of TB in Scotland since 2009
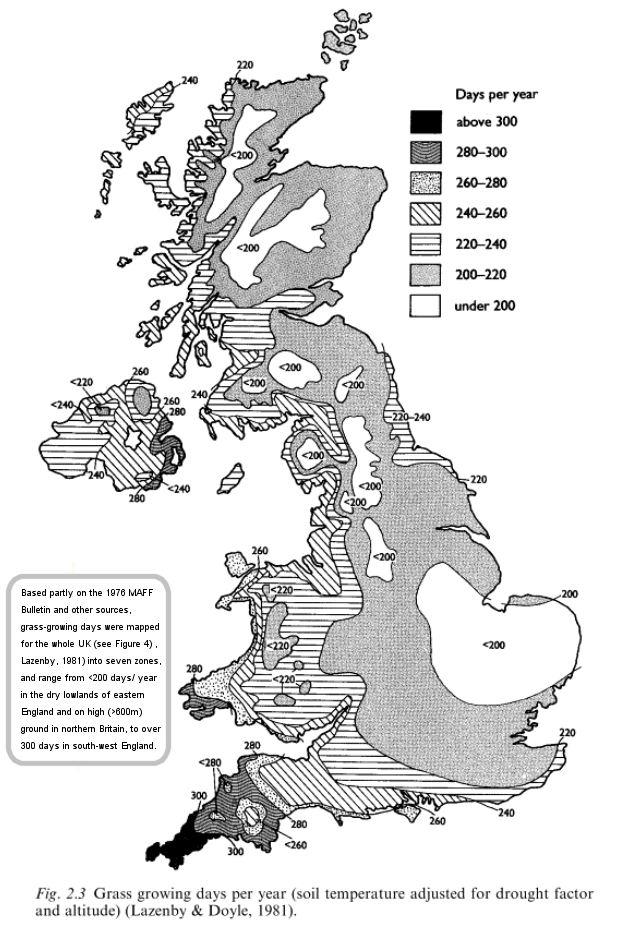
Wigtown county in South West Scotland has a unique climate created by the Gulf Stream.17 There are few places in the world with a similar climate - with the exception of the south of New Zealand's South Island, Ireland, and, of course, Cornwall and West Wales. This unique climate is particularly suited to growing grass. This provides good habitat for badgers.
Badger habitat also depends on the following.
- Farming operations. Earthworms are a common food source of badgers and worms are easy to catch especially in grass which has been cropped short by grazing cows or sheep. 18,14
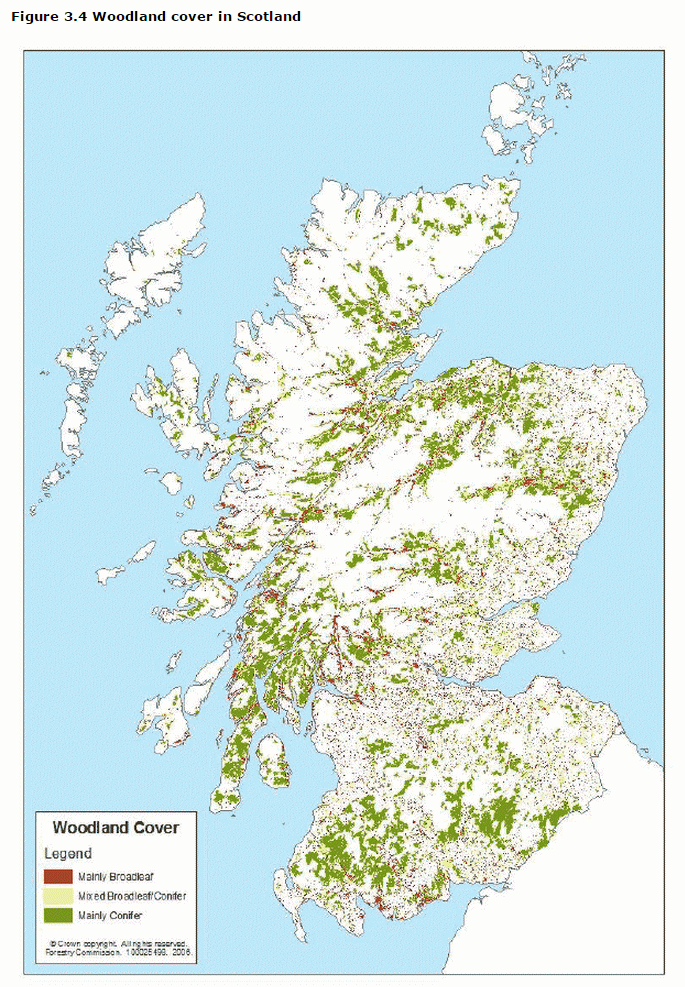
- Type of woodland cover. Deciduous woods, copses and hedgerows are the most usual locations for setts.19,14
- Soil type. Slopes and sandy soils provide good drainage and increase soil friability (i.e. ease of digging) facilitating sett construction.20,14
The number of TB disease restricted herds in Wigtown (which exclude restrictions imposed due to late tests) are shown for each month since Jan 2008 in the thumbnail below. Click on it to see the graphs clearly.
The graphs shown above, show the top 6 counties in Scotland for percentage of TB restricted herds (prevalence) for all counties for which the accumulated number of TB restricted herds in the county from Jan 2008 to Dec 2014 exceeded 100. Apparently the number of TB herds in Wigtown has exceeded by a large margin that in any other county since Jan 2009 and increased sharply in 2014.
The following thumbnails compare the proportion of herds which are disease restrcited in English edge counties with those in Wigtownshire.
As can be seen in the above graphs, the proportion of herds which were disease restricted in 2014 in Wigtownshire matched the proportion in Hampshire.
The graph below compares the total number of TB herd tests performed each month divided by the number of disease restricted herds in Hampshire with that in Wigtownshire.
Evidently more tests for each disease restricted herd were performed in Hampshire in 2013 and 2014 than in Wigtownshire. These disease restricted herds do NOT include herds restricted due to late testing.
Reference 22 which is a response from Endemic Disease Control, Animal Health & Welfare, The Scottish Government dated 10 April 2015 states that in Wigtownshire there have been no post-mortem examinations of badgers in the last six years. Reference 22 also assertively states that the majority of breakdown cases were the result of buying cattle from outside Scotland. It also states that for other cases, infection was not confirmed at post-mortem and that restrictions for all such cases have now [10 April 2015] been lifted. It goes on to say that the Scottish Government is acutely aware of the threat that any emerging wildlife reservoirs could pose and ongoing and intensive analysis is dedicated to the early detection of changes in the epidemiology of the disease.
The following thumbnails show the number of TB tests performed in Wigtown since 2008. Click on them to see the graphs clearly.
According to APHA data (11Mar2015 SAM download), the number of tests significantly reduced in 2013. However this did not correspond to a drop in detected TB levels. Moreover when in 2014 the annual number of tests returned to what they were in previous years, TB levels increased sharply. It is sobering to reflect that Wigtown in 2014 had the same prevalence of TB in terms of the percentage of TB restricted herds as Cheshire had in 2010 which is only 4 years earlier. Coupled to this is the fact that Wigtown has an exceptional grass growing climate comparable to that in West Wales.17 This provides favourable habitat for badgers. This makes the current situation in Wigtown very worrying not only for Scotland but also England because if TB becomes established in Wigtown, TB will be then both south and north of the very large and cattle dense counties of Lancashire, Cumbria and North Yorkshire.
If this worrying situation is not due to a benign issue, such as APHA data collection or processing errors, and if Scotland wants to maintain its TB free status, Scotland needs to get on top of this situation as soon as possible. In my view this should be done by establishing if and where a persistent pocket of TB is forming in the county and carrying out intensive testing of badgers in this area. In order to do this effectively in large enough numbers, it may prove necessary to cage trap / snare, blood test and release badgers by dedicated, paid staff. Collecting road kill is unlikely to retrieve a satifactory sample in the area affected. This area is likely to be very small and may only cover 2 or 3 farms (if any) where circumstances point to a wildlife vector.
The upsurge in TB cases may be no cause for concern and may be due to a data processing/interpretation oversight or due to trading practices by two or three rogue dealers. However if authorities have any doubt that this is the case, in view of what Scotland has to lose, if there ever has been a time and place to pump resource into screening, it is now in the Scottish county of Wigtown. On 10 April 2015 (Reference 22), the Scottish Government did not appear to perceive risk as sufficiently high to merit putting additional resource into screening.
REFERENCES
- Number of holdings and cattle in Scotland
- TB restricted herds and cattle reactors by county in Great Britain
- Badgers and Bovine Tuberculosis 2009 by the Mammal Society
- Badgers and Bovine TB in Scotland published in 2000
- Sixty cattle slaughtered after bovine TB outbreak in Scotland. Farmers Guardian. April 2012.
- Scotland's TB free status 'not threatened by outbreak' - 4/13/2012 - Farmers Weekly
- TB outbreak 'not caused by wildlife'. Herald Scotland. May 2012.
- Scottish badger distribution survey. Scottish Badgers charity. 2007-2009.
- Estimated proportion of confirmed herd breakdowns attributed to infectious badgers. Personal communication from Christl Donnelly. Jan 2012.
- Applications to interfere with Badger setts. FOI request. Scottish Natural Heritage. April 2012.
- Applications to interfere with Badger setts. FOI request. CCW. April 2012.
- Applications to interfere with Badger setts. FOI request to Wales Government. May 2012.
- A spatial analysis of trends in the UK climate since 1914 using gridded datasets
- The European badger. Badger Trust. Revised October 2011.
- Climate of the United Kingdom. Wikipedia. Last modified on 13 May 2012.
- CLIMATE CHANGE: the impact on biodiversity. 2006. Earthwatch Institute.
- Farm focus: Running a New Zealand grazing system in south west Scotland. Farmers Guardian. 7th November 2014.
- Earthworms. Badgerland.
- Habitat. Badgerland.
- Department of Agriculture and Rural Development - Badger Survey of Northern Ireland 2007/08 - Quercus Project QU07-13
- Scottish Badger Distribution Survey 2006 - 2009. E Rainey et al. Report prepared by Scottish Badgers and Biomathematics and Statistics Scotland. November 2009.
- Bovine TB persistence in Wigtown. FoI response from scotland.gsi.gov.uk. Sent 10 April 2015.