
RBCT problems, some literature, and a closer examination of reported data
The Randomised Badger Culling Trial (RBCT) was a badger culling trial conducted in England between 1998 and 2005 which was overseen by the Independent Scientific Group (ISG). The following shows links to two RBCT articles published in August 2016. Impact based on more extensive data How big was the perturbation effect?Trial objectives
The following shows an extract from the first report submitted from the ISG to the Rt Hon Dr Jack Cunningham MP in July 1998.34-
Having reviewed the evidence, we consider that the following key
scientific questions must be addressed if a sustainable cattle TB control policy
is to be implemented.
- What is the quantitative contribution of badgers to TB infection in cattle and do the recommended proactive or reactive culling strategies result in a significant reduction in incidence of herd breakdowns?
- Might alternative badger control strategies, such as maintaining badger populations below a certain threshold, be used to control disease in cattle?
- Would these badger control strategies be cost effective?
- Can modifications be made to farm management practices that will reduce the transmission of M. bovis to cattle?
- Could monitoring of badger population density and/or prevalence of infection in badgers be used to predict risk of infection in local cattle populations?
- These key questions lead to other overlapping questions:
Questions to be addressed
Further down the report34, it states the following aim which I refer to in the section below.
- The procedures for badger culling operations must balance efficiency of removal with considerations of animal welfare and cost... In proactive treatment areas, the aim is to remove as large a proportion as possible of badgers resident within the treatment area, and to prevent recolonisation by further culling on a regular basis...
Culling procedures
Background to previous trials
In 1994, four years prior to the start of the RBCT, data from 1966 to 1992 was published36 for the Thornbury badger culling trial where badgers were culled between 1975 and 1981 in an area encompassing part of Gloucestershire and Avon. This was probably the most thorough cull of badgers which was ever undertaken in the UK over a large enough area when multiplied by time period to yield meaningful results. Although other trials took place such as at Hartland in North Devon and Steeple Leaze in Dorset, badgers in these areas were culled over smaller areas, namely 62km2 and 12km2 respectively. In the Thornbury trial, badgers were culled over 104km2. Also, data exists for the Thornbury trial both in the culling area and in the whole of the South West for 9 years prior to the start of the cull and 32 years after it finished.36,40 The size of the cull area coupled with the number of years over which data exists for this trial means that statistically significant results can be derived from the data. Also, less culling of badgers took place in the culling area and the wider surrounding area during the post cull years, relative to that which took place after trials in the Irish Republic. This means that the impact of the cull in post-cull years could be better assessed. Lastly the trial took place in an area of persistent TB where TB was very high relative to other parts of the country and had remained so since Britain became attested in 1960. As such cattle measures in the area were failing so there was a pressing need to find out why.Regarding the results of the Thornbury trial, herd incidence, including unconfirmed cases, dropped relative to incidence prior to culling to 15% when averaged over 10 years after culling. Levels in the whole of the South West during the same period only dropped to 60% of the pre-cull levels. If only confirmed cases are examined, no confirmed cases occurred for 10 years after the culling stopped. In order to achieve these reductions, badgers were gassed for 2 years and recolonisation was prevented by further gassing for a further 4 years. As such the culling was considered to be thorough. However although a substantial drop in herd incidence was seen, only one area was treated.
The results of the Thornbury trial are fairly conclusive in view of the persistent nature of the disease evident in the years leading up to the start of the trial and how disease levels in the area compared to disease levels in the whole of the South West after culling stopped. It is also widely believed that the drop in levels is due to the culling of badgers. In fact in 2004 when Owen-Paterson asked Ben Bradshaw, the then Under Secretary of State for DEFRA, the following question44,
What assessment she (Margaret Beckett) has made of other causes to which the reduction in bovine TB could be attributed in the Thornbury experiment, other than the clearance of badgers.
Mr Bradshaw replied as follows.
The fundamental difference between the Thornbury area and other areas in south west England, where bovine tuberculosis was a problem, was the systematic removal badgers from the Thornbury area. No other species was similarly removed. No other contemporaneous change was identified that could have accounted for the reduction in TB incidence within the area.
However, it is possible (although unlikely) that something occurred in Thornbury during and after the cull other than the removal of badgers which made herd incidence drop. The aim of the RBCT was to investigate culling on a more scientific basis by culling in more than one area. In this way there would be greater reassurance that no special factors in any given area would significantly distort the results since the results would be averaged over all areas. Hence the RBCT was proposed where, as stated in the report presented by the ISG to the UK Minister of Agriculture,34 one of the aims was to remove as large a proportion as possible of badgers resident within the treatment area, and to prevent recolonisation by further culling on a regular basis.
Critical reviews of the RBCT
Was a large as possible proportion of badgers resident within the treatment areas removed?In Ref 45, the ISG who oversaw the trial, stated the following.
Implicit in our approach is the recognition that the widespread elimination of badgers from large tracts of the countryside would not be politically or socially acceptable, hence we have sought to explore a much wider consideration of the problem and its possible solution(s).
In the RBCT was a large enough proportion of badgers removed to reveal quantitatively the contribution of badgers to TB infection in cattle? The 9-point list in Reference 32 submitted by Dr L.H. Thomas et al outlines issues which cast serious doubts as to whether the culling was sufficiently thorough particularly in the initial crucial years leading up to Foot and Mouth. References 31 and 33 also submitted by Dr L.H Thomas et al gives some further background.
Highly critical comments concerning how the trial was conducted were submitted in a memorandum1 in 2006 by a staff manager. Conclusions reached in the final RBCT report2 differed in a number of respects from those reached by the then Chief Scientific Advisor, Sir David King3 who also questioned whether certain sections had been peer reviewed37. More et al4 looked at how the reactive elements of the trial were interpreted. Dr J Gallagher et al14 questioned the emphasis given to cattle to cattle transmission and how the badger culling was carried out.
The following are some extracts from the comments made by Dr J Gallagher et al14.
The ISG Final Report data showed 5 of the crucial initial 10 proactive culls were carried out in midwinter which is well known to be the least successful time for trapping. Trapping was carried out for eight days on average and only once a year. The average annual rate for the removal of badgers was 1.8 badgers per km2 with a variation from 0.7 to 2.91. Poor culling efficiency would be expected to cause social disruption and dispersal (perturbation) of infected badgers. Culling rationally must always aim to remove the entire social group. It should avoid dispersing infection to make the situation worse both in the badger population as well as for cattle and of course all other species sharing the badger's habitat.
Cage trapping was used in the Hartland, Devon control exercise in 1984 and resulted in a fall in confirmed herd outbreaks in cattle from 15% to 4% in 1985 (Krebs 1987). Thereafter annual incidence declined and held at around 1% for nearly 10 years. In excess of 80% to almost 90% of badgers were removed which required protracted trapping efforts in some of the area. In some difficult parts trapping continued for up to three months . The area involved was 62 km2 and no so called edge effect was seen during or after this removal.
RBCT versus Four-Area Trial
The following table shows how some metrics in the RBCT differed from the Irish Four-Area Trial. This data was taken from C.M O'Connor et al5, J.M Griffin et al41, F.J Bourne et al2 and C.A Donnelly & J Hone42.Evidently in the first cull of the RBCT only 35% of the total number of badgers were removed whereas in the Four-Area Trial 50% were removed.
| Name of the trial | Years when badgers culled | Total size of the treatment areas | Total number of badgers removed in the treatment areas | Proportion of badgers removed in the first cull |
|---|---|---|---|---|
| RBCT in England | 1998-2005 | 1000 square km (Ref 2) | 8910 (1.8 badgers/square km/year) | 3139/8910 = 35% (See Page 49 of Ref 2 and Page 10 of Ref 42) |
| Four-Area Trial in Ireland | 1997-2002 | 1214 square km (Ref 2) | 1579 (0.3 badgers/square km/year) | 791/1579 = 50% (See Page 630 of Ref 41) |
Timescale extension
The following extract6 gives a little background on time scales associated with the RBCT.Although it had been intended that one removal programme should take place each year in each proactive trial area annually for 5 years, in practice, most of the areas had five removal operations (range 4 to 7) over 5 or 6 years (range 4 to 8 years). Furthermore, the trial was interrupted by the outbreak of Foot and Mouth Disease in 2001 and analysis was complicated further by the subsequent disruptions to TB testing.
Trapping disruption
Parliamentary Questions11 in 2003 reported the following regarding disruption to trapping operations.Mr. Paterson: To ask the Secretary of State for Environment, Food and Rural Affairs in how many cases badger traps laid by or on behalf of the Department in TB culling trials have been interfered with or removed without authorisation. [141971]
8 Dec 2003 : Column 219W
Mr. Bradshaw: Interference with badger traps laid in the Randomised Badger Culling Trial is variable between operations. It is usually quite geographically localised and repetitive within a culling operational area. Management records indicate that over 116 culling operations, across 19 trial areas, between December 1998 and 10 October 2003, during which 15,666 traps were sited there were 8,981 individual occasions where a trap was interfered with, and 1,827 individual occasions when a trap was removed.
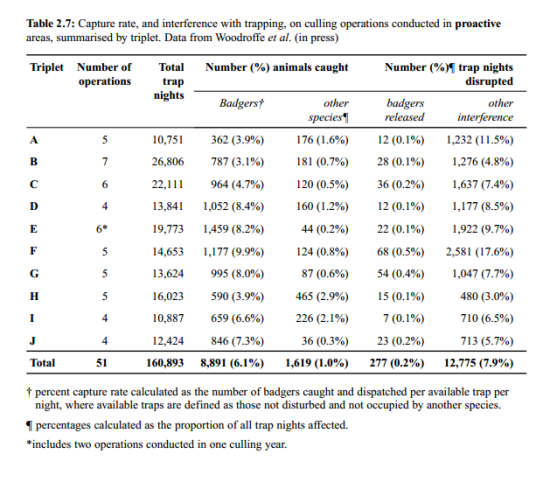
These numbers are large and it is unfortunate that the size of this impact on culling effectiveness cannot be estimated. The percentage of trap nights disrupted by interference in the proactive areas are shown in Table 2.7 of the final report2. This table is shown below.
 The extent of disruption in the reactive areas is given in Table 2.8 of the final report2. The following Twitter comments are made by someone who has said that he carried out culling during the trial.
The comments suggest that
it was not
possible to monitor interference in the reactive areas closely enough to establish the extent to which such interference was taking place.
The extent of disruption in the reactive areas is given in Table 2.8 of the final report2. The following Twitter comments are made by someone who has said that he carried out culling during the trial.
The comments suggest that
it was not
possible to monitor interference in the reactive areas closely enough to establish the extent to which such interference was taking place.
@phillatham @bovinetb No, if you look it's the reactive areas that suffered from most 'perturbation'. That was because the R culling (cont)
— Matt the Rat (@rantingratman) May 15, 2013
@phillatham @bovinetb was much lower key, with smaller teams and less police protection. It was also over longer periods of time.
— Matt the Rat (@rantingratman) May 15, 2013
@phillatham ARA's knew which farms we were working on in reactive areas and didn't care about anything except 'saving' badgers from us.
— Matt the Rat (@rantingratman) May 15, 2013
The following table shows how much disruption was monitored each year. This table was provided by DEFRA in response to a Freedom of Information request39.
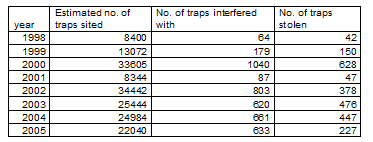
Summing numbers in the last column gives 2,395 for the total number of traps stolen.
Number of badgers culled and disease levels found in badgers
8,910 badgers were culled in proactive areas and 2,069 were culled in reactive areas. The following graphs illustrate the number of badgers culled in the proactive areas as tabulated in Table 4.8 of Reference 2. As such these graphs show all badgers culled except for 20. Hence 99.8% of all badgers culled are shown.In the above graph the largest number of badgers culled in any one area was 1,459 (Area E) and the smallest number of badgers culled was 362 (Area A). No culling took place in 2001 due to Foot and Mouth. In Area E, 747 badgers were culled in 2000. Unlike in other areas and years, 2 culls were performed in this area and year. Table 2.7 in Reference 2 reports that 17.6% of traps were interfered with in Area F (where 1,177 badgers were culled) and 11.5% of traps were interfered with in Area A. Interference in other areas were less.
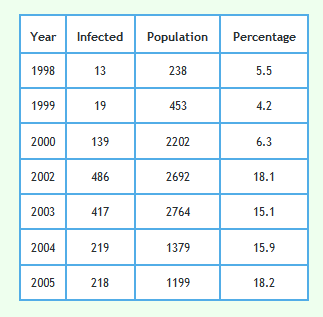
Perhaps it should be noted in passing that the percentage of badgers, which were found to be infected by bovine TB, doubled between 2000 and 2003 as shown in Fig 27 below. This data was taken from Table 4.8 in the RBCT Final Report2. Authors of this work acknowledged that there were some shortcomings associated with how these disease levels were identified so these estimates should be regarded as underestimates. For example storage of carcasses, which were almost always frozen for greater than 7 days before necropsy, reduced the probability of detecting infection. However this only affected about 10% of carcasses overall and the same methods for detecting disease were used throughout the work. Nevertheless the overall average percentage of infected badgers when summed across all the proactive areas shown in Table 4.8 of the RBCT Final Report2 is 13.6% and the percentages shown in the plot below (which overall average 8.5%) are somewhat lower than this average. Such disparity is not surprising because of the large disparity in the prevalence of the disease between cattle in more southern and more northern counties27. It is commonly observed that the prevalence of the disease in the 2 species closely follow each other.
If detection became more thorough as the trial progressed this would have increased the percentage of badgers identified with the disease with each successive cull. However it is stated in the Final Report that under-estimation of prevalence is expected to be consistent across triplets, treatments and years and should not, therefore, influence the interpretation of patterns of M. bovis prevalence. This implies that any tendency to improve detection as the trial progressed, and hence the percentages shown in the plot below, was resisted.
Another important consideration is that when the data in datasets shown in Refs 50 (proactive cull data) and 51 (reactive cull data) are plotted in Fig 428, the infection in badgers tripled during the Foot and Mouth lull. Infection remained relatively constant either side of this lull when the culling took place. It is quite possible that infection in badgers did not increase due to culling but due to difficulty disclosing TB infection due to bacteria overgrowth during the delay before post-mortems were performed. Perhaps the backlog of decaying carcasses was cleared during the Foot and Mouth lull. TB disclosure during post-mortems, recommended guidelines and what happened when carcasses were post-mortemed during the RBCT are given here.
It is worth noting that when a more detailed analysis was carried out on the badgers which were postmortemed during the RBCT, the number of badgers which were found to be infected doubled. Details are given in Reference 29.
In the above graph, the total number of badgers culled in 2002 was 2053, in 2003 it was 1660, in 2004 it was 1381, and in 2005 it was 1206. These numbers decline smoothly. If it is assumed that
- there is a trappable population and a trap-shy population,
- each year, in the absence of culling, the number of natural deaths roughly match the number of births, (Please note: In the last 25 years the badger population is thought to have significantly increased.)
- the average life expectancy of a wild badger is 4 years,
- the number of badgers immigrating into proactive areas did not significantly exceed numbers emigrating, (Please note: Over time there will be net immigration to re-establish a stable badger density.)
- conditions such as availability of food and trapping effort did not significantly change for each year, and
- in the trappable population, the number of badgers culled as a percentage of badgers existing at the beginning of that year did not change for each year,
When these assumptions are made, the total population of trappable badgers in the 10 areas at the start of year 2002 is calculated to be about 12,000. Each area is 100 km2 and if 12,000 badgers occupy the 10 areas, this gives a badger density of 12 badgers per km2 which, although higher than estimates provided in Reference 2, is feasible in small areas. (Reference 15 states that, in England, population density can be as high as 20 to 30 badgers per km2. However the average across all ten triplets of the RBCT was estimated to be about 4 badgers per km2 according to Table 4.4 on page 67 of Reference 2.) Although 12 badgers per km2 does seem high, if this estimate applies, and all existing badgers are assumed to be trappable, this number yields 5,700 badgers at the end of year 2005 using the number of badgers culled each year. Hence 52.5% of badgers were culled. If one in every 3 badgers due to age or some other reason is trap-shy or did not see a trap, then instead of 12,000 badgers existing at the start of year 2002, there would be 18,000. An extra 6000 badgers would exist at the end of year 2005 (assuming the number of births equals the number of natural deaths) so there would be 11,700 badgers at the end of year 2005 instead of 5,700. This yields 35% as the percentage of badgers culled. A net immigration of badgers into the proactive areas would have the affect of making the estimated badger density to be greater than what it actually is. It would also lead to an underestimation of the percentage of badgers culled. Any births outnumbering natural deaths would reduce this affect. Also, the prolonged affect of culling which data22 made available in September 2011 suggested was still existing in August 2011, implies that such immigration will take at least 6 years. If no account is taken of badger life expectancy, the 2,592 badgers culled in 1998,1999 and 2000 increase the estimated percentage of badgers culled from the stated 35% to 49%. If the trap-shy population was assumed to be zero, the 52.5% stated above would increase to 74%. However the average life expectancy of a wild badger is about 4 years and 1998 to 2005 spans 7 years. The impact of culling a certain number of badgers on the badger population at any point in time will reduce as the number of culling years increases. For example, the impact of culling a certain number evenly over 8 years instead of 4 would be half because the culling years would span 2 generations. In view of this the badgers culled in 1998, 1999 and 2000 would be expected to increase the percentage of badgers culled but not to the extents stated above. In view of all this, it is most likely that the percentage by which badgers numbers were reduced between 1998 and 2005, due to culling, lies somewhere between 35 and 74%.
Reference 2 used sightings of active badger setts, latrines and road deaths before and after culling to conclude that proactive culling caused substantial reductions in badger density. These sightings were reported to reduce by about 70%.
Reported cost effectiveness of the trial
On 10th Feb 2010 Imperial College London published an article which prematurely stated that culling benefits declined over time and were no longer detectable four years after the last annual cull and that they in fact diminished by 14.3% every six months.7 This means that the cost of culling as performed in the RBCT was thought to be between 2 and 3 times greater than the cost savings returned from reduced incidence of infection in cattle herds8. Hence culling as performed in the RBCT does not appear to be cost effective and culling effects are short lived23.Are the culling effects short lived? In the light of more data, this is examined below.
A closer look at the data
Regarding the results from the RBCT, shown below are the relevant graphs. In these graphs, the quantity plotted is the percentage change in incidence of confirmed breakdowns in cattle relative to the incidence seen in a control area where no culling took place. "Adjoining lands" describes an area less than or equal to 2 km outside the culling area. This area is where diseased, displaced badgers tend to increase the incidence in cattle due to perturbation. All time scales refer to time scales after one year after culling ceased.It should be noted that the values shown on these graphs should be interpreted with caution as they are very rough and subject to variations which may be largely due to statistical error. The 95% confidence intervals are plotted in Figure 1 of Reference 7.
The line labeled "inside culling area up to july2010" in the lower graph shows data reported in Reference 9. All other lines show data reported earlier in Reference 7. As such, Reference 7 furnished the green line in the lower graph. Perhaps it was from data shown on this line that the 14.3% decline in culling benefit every 6 months was estimated, although the line, end-to-end, only gives a 12% decline. Data acquired up to July 2010 (shown by the shallower purple line) implies that the 14.3% decline under-estimates actual persistence and hence the RBCT's cost effectiveness. (Reference 9 points out that the 43 to 48 month time period had 4.3 triplet-years of data as of 2 July 2010; other time periods had the full 5.0 triplet-years)
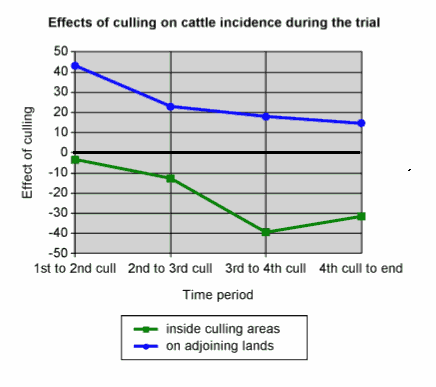
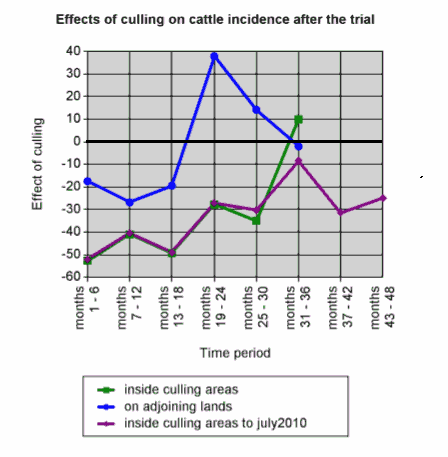
In the upper graph, values on both lines tend to reduce with each cull. In fact at the end of the 4th cull, cattle incidence due to perturbation had dropped to 12%. This and the trend for increasing benefit in the culling area which was 30% at the end of the 4th cull illustrates why culling should be performed for a minimum length of time.
Reference 7, from which data is plotted in green in the above graph, was published before results for months 37 to 48 were known. Reference 7 stated the following regarding the time needed for badger numbers to recover.
" While it is impossible to determine whether the system has now returned to equilibrium, in other studies badger numbers have taken five to ten years to recover from culls, suggesting that growth of the badger populations in RBCT proactive areas may continue for several more years. "
If it can be assumed that the observed persistence in reduced cattle incidence is due to reduced badger numbers, it would appear that badger populations in RBCT proactive areas between months 37 to 48 were still growing.
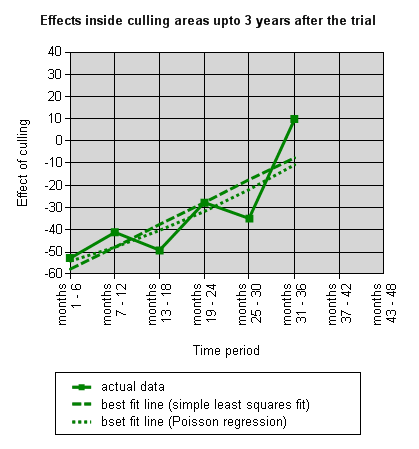
Shown below is the best fitting straight line (best least squares fit) for data available up to 3 years after the trial which is tabulated in Ref 7. This line gives a 10% reduction in benefit every 6 months. Ref 7 reported a 14.3% reduction.
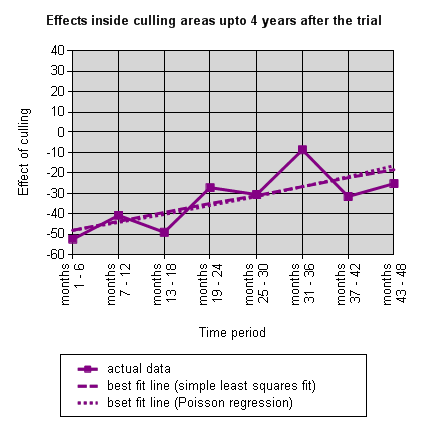
Shown below is the least squares fit to the more complete data available in July 2010 which is tabulated in Ref 9. This line gives a 4% reduction in culling benefit every 6 months. Obviously, the authors of the report in Reference 7 which reported a 14.3% reduction could only present data which was available to them at the time of publication.
The rate at which badgers recolonise
The following is an extract taken from Reference 30.From our current knowledge of badgers, it would seem unlikely that badgers would rapidly expand their range or recolonise cleared areas quickly. Kruuk & Macdonald (1985) have described badgers as contractionist by nature, and said that they do not rapidly colonise vacant habitats. This has been the experience at two sites, one in Avon and the other in Gloucestershire, that were cleared of badgers by the Ministry of Agriculture, Fisheries and Food as part of their TB control operations. In the Avon operation 100 km2 were cleared of badgers by 1978, and maintained free of badgers until 1981. By the end of 1988 recolonisation of this area was nowhere near complete. At the Gloucestershire site, 12 social groups were removed in three different operations in an area of very high badger density. When a single social group of badgers were removed, recolonisation was complete in three years, but when five social groups were removed in one control operation and six in another, it took nine to 10 years after the control operations for the badgers to attain their former numbers (CL Cheeseman pers. comm.).
A simple analysis
This section queries what work has been done to look at herd incidence prior to culling.Shown in the graph below are the culling effects after amalgamating results from the 10 areas and summing herd incidences and the number of baseline herds. These culling effects are shown by the dashed lines. Pre-cull data was taken from Reference 18 and during-cull and post-cull data was taken from Tables S2 and S3 in Reference 16. Culling effects calculated by the ISG analysis are shown by the solid lines for which results were taken from Tables 1 and 2 in Reference 19.
Definition of the culling effect in the above graph, when obtained by summing values, is given below.
Culling effect = (∑1/∑2)/(∑3/∑4) * 100 - 100
where
∑1 = sum of confirmed breakdown incidences in the 10 treatment or adjoining areas
∑2 = sum of baseline herds in the 10 treatment or adjoining areas
∑3 = sum of confirmed breakdown incidences in the 10 survey-only or adjoining areas
∑4 = sum of baseline herds in the 10 survey-only or adjoining areas.
Definition of the culling effect in the above graph, when obtained by Poisson Regression in the ISG analysis, is explained in Reference 26.
Definition of time periods in the above graph are given below.
- pre_3yr - 3-year period before culling started over which data was combined
- pre_1yr - 1 year before culling started (Areas D,I,J use data in year before Foot and Mouth)
- cull1 - from the end of the initial cull in that triplet to the end of the second cull
- cull2 - from the end of the second cull in that triplet to the end of the third cull
- cull3 - from the end of the third cull in that triplet to the end of the fourth cull
- cull4 - from the end of the fourth cull in that triplet to one year after the end of the last cull
- post1 - months 1-12 after the cull4 time period
- post2 - months 13 to 6 January 2008
In the simple analysis, herd incidences in each of the 10 areas are simply weighted according to how many baseline herds they contain. Indeed, unlike in the ISG analysis, no account is taken for herd incidence in each area in the 3 years before culling started. It should be noted that account for this is important. As can be seen in the graph, the "culling effect" values (as defined by the formula above) on the adjoining levels in the pre-cull years were very low. This incidence history is probably responsible for why the ISG line for data on the adjoining lands is substantially higher than the simple analysis line and why the ISG line is lower than the simple values inside the culling areas.
It should be noted that data only extends to 6th January 2008 so the result for the post2 time period is based on incomplete data. It can be deduced from subsequent ISG analysis7, and by examining the graphs shown earlier above, that the missing data for this time period significantly reduced the culling effect. This is an indication of how the results in this reduced time period were impacted by the smaller sample size and larger statistical error.
Regarding errors and accountability, little evidence has been found of published work which examines how herd incidence varies in the RBCT areas in the pre-cull years. A survey carried out in this work to locate an analysis of pre-cull data, only located work which referenced data in the year preceding culling and data over a 3-year period and a 10-year period after such data was amalgamated. This data is referenced in Tables 9 and 10 in Reference 26. It would be reassuring to see an analysis of data for each year for a number of years prior to culling to gain more insight into data variation and stability. This would have helped to establish that effects seen during and after the cull in both the treatment areas and adjoining lands when plotted over time are real and can be properly attributed.
Unfortunately culling took place in the RBCT areas in the pre-RBCT years as part of the interim strategy whereby badgers were culled from farms where a TB incident had been confirmed and where it was thought badgers were the cause. In order for the proposed analysis in these early pre-RBCT years to be unaffected by this culling, the number of badgers culled in and around the RBCT areas needs to have matching impact in the proactive and survey-only areas for each year. Unfortunately data in the RBCT Final Report (Reference 2) appears to give a rather limited picture of where, when and to what extent culling took place in these pre-RBCT years. For instance, the report neither gives figures for the number of badgers culled in the adjoining lands nor a yearly breakdown for any area. Having said this, Table 4.1 in the report shows the total number of badgers culled in the proactive areas between 1986 and 1998 to exceed the total number culled in the survey-only areas by 40% and to be 22% of the number of badgers culled in the proactive areas during the RBCT years of 1998 to 2005. This indicates that culling during the RBCT years was a lot more intense than in the previous interim strategy years.
For a more complete, simple analysis of RBCT data, please click here.
The latest data
In the graph below, data is shown which was reported in February 20107, April 201122 and September 201128. The statement23 referred to earlier regarding culling being short-lived was based on data reported in Feb 2010.The culling effect in the above graph is the percentage reduction in herd incidence in the proactive areas relative to that in the survey-only areas when calculated by Poisson Regression in the ISG Analysis26.
Definition of time periods in the above graph are given below.
- cull1 - from the end of the initial cull in that triplet to the end of the second cull
- cull2 - from the end of the second cull in that triplet to the end of the third cull
- cull3 - from the end of the third cull in that triplet to the end of the fourth cull
- cull4 - from the end of the fourth cull in that triplet to one year after the end of the last cull
- post1 - months 1-6 after the cull4 time period
- post2 - months 7-12
- post3 - months 13-18
- post4 - months 19-24
- post5 - months 25-30
- post6 - months 31-36
- post7 - months 37-42
- post8 - months 43-48
- post9 - months 49 to 54
- post10 - months 55 to 28 August 2011 (4.6 triplet years instead of 5)
The Final Report of the ISG on Cattle TB2 only show results obtained during the cull and makes no reference to results after culling stopped because, except for perhaps the very start of such data, such data was not available.
Relevance of incidence and prevalence as measures of badger culling benefit
Incidence proportion (also known as cumulative incidence) is the number of new cases within a specified time period divided by the size of the population initially at risk.49"Period prevalence" is the proportion of a population that has the condition at some time during a given period ("12-month prevalence", etc.), and includes subjects who already have the condition at the start of the study period as well as those who acquire it during that period.48
Relative to period prevalence, incidence gives higher weighting to sources of infection which cause cattle herds to go in and out of restriction since every time there is a re-occurrence during the reporting period incidence increases by one but prevalence stays the same. In addition to this incidence would be zero if all herds were infected. As such, incidence and prevalence give different pictures and just looking at incidence does not give the complete picture.
In the case of a source of infection which is not being addressed such as TB in badgers, disease in cattle herds is persisting. It follows that if the aim is to measure the impact of a badger culling exercise by using a measure which helps to isolate that source, it could be argued that prevalence should be used in preference to incidence. One member of the RBCT group (CA Donnelly) subsequent to the disbandment of the ISG has been involved in a study which looked at breakdown duration in RBCT data. This concluded that the culling strategies are unlikely to reduce either the prolongation or recurrence of breakdowns in the long term.47 However in presenting the benefit of culling in terms of a percentage drop, all analysis to-date [May 2015] has presented incidence only. Personal email correspondence received from Donnelly and DEFRA in May 2015 supports this view. According to that DEFRA correspondence, the latest report of ongoing work available in May 2015 presented data downloaded in July 2013. These results, in the form of both tables and graphs, are shown in Reference 46.
In summary, it appears that no work has been published to-date [May 2015] which presents the benefit of RBCT culling in terms of prevalence. Simply put, the impact of culling has not been presented in terms of extent but not in terms of events which gave rise to that extent. This distinction is important due to herd breakdown duration.
Some questions and answers
The following questions and answers are written in the context of the data and graphs shown above. Questions posed to and answered given by the MRC Centre for Outbreak Analysis and Modelling team24 are shown in Reference 13.- Question: What caused the differences between the percentage reductions shown tabulated in Reference
7 and 10
and those shown tabulated in Reference 22?
These differences can be seen by comparing the green and black lines in the above graph at time periods post5 and post6.
Answer: Results published in February 2010 were published before all data was available for the 6-month period covering months 31 to 36 so estimates for this last period were made using incomplete data.13 - Question: What preliminary work has been carried out to look at data stability and consistency prior to culling
in order to build up confidence that effects seen during the cull and after the cull are real and can be properly attributed? For instance, have
pre-cull values, as given by the above formula, been plotted for each year over a number of years to investigate this? Has the extent
to which these pre-cull values vary been examined and account been given for any major variations?
Answer: Data was analysed in the year prior to culling and analysed after amalgamating data across three years prior to the start of culling.20,21 - Question: When will the reported percentage reduction in culling benefit be adjusted to account for
currently available data? Based on the best-line fit covering 4 years after the trial, the percentage 6-monthly reduction
appears to be about 4%. (The analysis announced in Sep 2011 which covers 6 years after culling ended also appears to support this.)
Unless we have missed
a report, the 6-monthly reduction based on the MRC's Poisson Regression analysis is currently reported to be 14.3%.
Answer: This question was not specifically answered by the MRC Research Group24 but they have since kindly made the following data available. As of September 2011, data has been analysed up to 28 August 2011, and for the last 6-monthly period (4.6 triplet years), herd incidence in proactive areas is 11% lower than that in the survey-only areas28. Editor note: Culling stopped in October 2005 which is just less than 6 years ago (as of August 2011) so this latest data does not support the statement23 made in March 2010 by the MRC Research Group24 that the culling effects are short lived. - Question: Mr Bradshaw in 2003 answered the question regarding how many cases badger traps in the RBCT badger culling
trials have been interfered with or removed as follows.
"Between December 1998 and 10 October 2003, during which 15,666 traps were sited, there were 8,981 individual occasions where a
trap was interfered with, and 1,827 individual occasions when a trap was removed."
Are these figures accurate?
If so, how many of the 1,827 traps, which were moved, contained a badger? This is a huge number. If large numbers of badgers were relocated, how did this contribute to badger perturbation, increase herd incidence on lands outside the culling areas, and spread disease to new areas?
Are there any grounds on which it can be assumed with confidence that this did not significantly limit the overall effectiveness of the culling
which took place during the RBCT?
Answer: No answer to this has been forthcoming. - Question: Prof Bourne in his covering letter submitted with the Final Report2 said the following.
"Second, weaknesses in
cattle testing regimes mean that cattle themselves contribute significantly to the persistence
and spread of disease in all areas where TB occurs, and in some parts of Britain are likely
to be the main source of infection. Scientific findings indicate that the rising incidence of
disease can be reversed, and geographical spread contained, by the rigid application of
cattle-based control measures alone."
The overall conclusion in the report also included the following statement. "We further conclude from the scientific evidence available, that the rigorous application of heightened control measures directly targeting cattle will reverse the yearon- year increase in the incidence of cattle TB and halt the geographical spread of the disease."
Unlike the badger culling carried out at Thornbury, the badger culling carried out during the RBCT was by no means thorough enough to assess the impact of removing the badger vector. Also the RBCT trial was not designed to investigate the impact of improved cattle measures. Firstly, is this conclusion concerning the impact of cattle measures alone based on circumstantial data and assessments made from this data using a mathematical model? The section titled "Some assessments via mathematical modelling" on pages 147 to 149 of the final report2 suggests that it is. Secondly, Section 7.24 on Page 148 of the final report2 says that predictions based on this model would be "very tentative". Although it may have been impractical to set up a trial to look at cattle measures, why was the strident cattle measures statement in the conclusion made without any cautionary note concerning what the statement was based on? In fact the mathematical model assumed badger-to-cattle transmission only accounted for about a third of the infection. (See Section 7.24 on Page 148 of Ref 2.) Prof Donnelly, who was partly responsible for designing the RBCT24, estimated in January 2012 that based on initial culls in the RBCT, roughly half could be attributed to infectious badgers43.
Answer: Prof Bourne has not been approached for a comment regarding this. However he is quoted in a guardian.co.uk article38 published on 23rd October 2012 and his input is recorded in John Aitchison's blog at www.badgergate.org which was published in May 2013. In fact in this blog Prof Bourne is reported to have actually requested inclusion of statements which he made in his letter submitted with the RBCT final report2. Extracts from this blog are shown below.
Addendum
On 15th March 2016 the Animal and Plant Health Agency (APHA) made available for the first time raw prevalence and incidence data for the RBCT from 1986 to 2012. The following shows links to two RBCT articles published in August 2016. Impact based on more extensive data How big was the perturbation effect?References
- RBCT problems: Memorandum submitted by P Caruana (BTB 33)
- Final Report of the Independent Scientific Group on Cattle TB
- Bovine Tuberculosis in cattle and badgers, a report by the Chief Scientific Adviser, Sir David King
- Does reactive badger culling lead to an increase in tuberculosis in cattle?
- Great Britain and Republic of Ireland badger culling trials: An initial comparative study. Published in 2009 by C.M O'Connor et al at Glasgow University
- DEFRA consultation Sept 2010: Annex B - Scientific evidence on culling
- RBCT: The Duration of Culling Effects
- Benefits of badger culling not long lasting for reducing cattle TB
- RBCT: Analysis of further data to 2July2010
- Table 1 in Reference 7
- House of Commons Hansard Written Answers for 8 Dec 2003 (pt 6)
- More on the RBCT. A vet's view. June 09, 2006
- Some answers to observed rates at which culling effects reduce after badger culling ceased in the RBCT
- Memorandum submitted by Former Veterinary Officers, State Veterinary Service submitted November 2007
- Bovine Tuberculosis TB Annual Meeting for Great Britain 17th May 2007
- The effects of annual widespread badger culls on cattle tuberculosis following the cessation of culling - Supplementary Information. HE Jenkins et al. International Journal of Infectious Diseases Volume 12, Issue 5, Pages 457-465. September 2008.
- Table 3 in Reference 7
- Positive and negative effects of widespread badger culling on tuberculosis in cattle - Supplementary data. Nature04454-s2.xls
- The effects of annual widespread badger culls on cattle tuberculosis following the cessation of culling
- Analysis of data prior to culling - the question
- Analysis of data prior to culling - the answer
- Analysis of further data (to 25 February 2011) on the impacts on cattle TB incidence of repeated badger culling
- Effects of badger culling prove short-lived
- Members of the MRC Centre for Outbreak Analysis and Modelling Research Group
- Bovine TB in Cattle & Badgers brief from RSPCA Cymru
- Positive and negative effects of widespread badger culling on tuberculosis in cattle. Nature, 439, 843-846. Donnelly CA, Woodroffe R, Cox DR, Bourne FJ, Cheeseman CL et al. (2006). Supplementary Information
- Prevalence and transmission of bovine TB between cattle and badgers
- Analysis of further data (to 28 August 2011) on the impacts on cattle TB incidence of repeated badger culling
- Comparison of a standard and a detailed postmortem protocol for detecting Mycobacterium bovis in badgers.
- The History, Distribution, Status and Habitat Requirements of the Badger in Britain. Peterborough; Nature Conservancy Council. Authored by P Cresswell, S Harris and DJ Jefferies. 1990.
- An open letter on badgers and bovine TB from L.H.Thomas to Mr. Miliband dated 13th July 2006.
- Failings of the Randomised Badger Culling Trials. L.H Thomas. July 2006.
- Chronology of events associated with bovine tuberculosis in the UK, 1960 to 2005. Compiled on 20th June 2006 by L.H. Thomas.
- First Report to the Rt Hon Dr Jack Cunningham MP from the Independent Scientific Group on Cattle TB - July 1998
- Krebs, J.R., Anderson, R.M., Clutton-Brock, T., Morrison, W.I., Young, D. and Donnelly,C.A., Bovine tuberculosis in cattle and badgers, MAFF Publications, PB3423, London.(1997)
- The occurrence of Mycobacterium bovis infection in cattle in and around an area subject to extensive badger control. R S CLIFTON-HADLEY et al. Epidemiology Department, Central Veterinary Laboratory, Surrey. Accepted 3 October 1994.
- BADGERS AND BOVINE TB REPORT David King letter to Michael Jack MP 18 Dec 2007
- Badger cull U-turn: precious time has been wasted on this foolish policy. Damian Carrington. guardian.co.uk. 23 October 2012.
- RBCT: Number of traps interfered with and removed each year. Freedom of Information response. DEFRA. RFI 4380. 28th Nov 2011.
- Number of herd incidences of TB in the South West and Thornbury. FoI to DEFRA. RFI 5287. 5th April 2013.
- Tuberculosis in cattle: the results of the four-area project. Irish Veterinary Journal. Volume 58 (11) : November, 2005.
- Association between Levels of TB in Cattle Herds and Badgers. C.A Donnelly and J Hone. 2010.
- Estimated proportion of confirmed herd breakdowns attributed to infectious badgers. Personal communication from Christl Donnelly. Jan 2012.
- Badgers/Bovine TB. ENVIRONMENT, FOOD AND RURAL AFFAIRS. Written Answers to Questions. 24 March 2004.
- House of Commons Environment, Food and Rural Affairs Committee Badgers and cattle TB: the final report of the Independent Scientific Group on Cattle TB Fourth Report of Session 2007-08 Volume I
- Results from the Randomised Badger Culling Trial based on data downloaded in July 2013. Report to Defra.
- The Effect of Badger Culling on Breakdown Prolongation and Recurrence of Bovine Tuberculosis in Cattle Herds in Great Britain. K Karolemeas et al. DEFRA and Hefce funded. plos.org. Received 31 May 2012. Accepted 1 November 2012. Published 7 December 2012.
- Prevalence. Wikipedia. Last modified on 28 February 2015.
- Incidence. Wikipedia. Last modified on 26 April 2015.
- Supporting Data Set 1 extracted from http://www.pnas.org/content/103/40/14713.full?tab=ds. Culling and cattle controls influence tuberculosis risk for badgers. R Woodroffe et al. 2006.
- Supporting Data Set 2 extracted from http://www.pnas.org/content/103/40/14713.full?tab=ds. Culling and cattle controls influence tuberculosis risk for badgers. R Woodroffe et al. 2006.